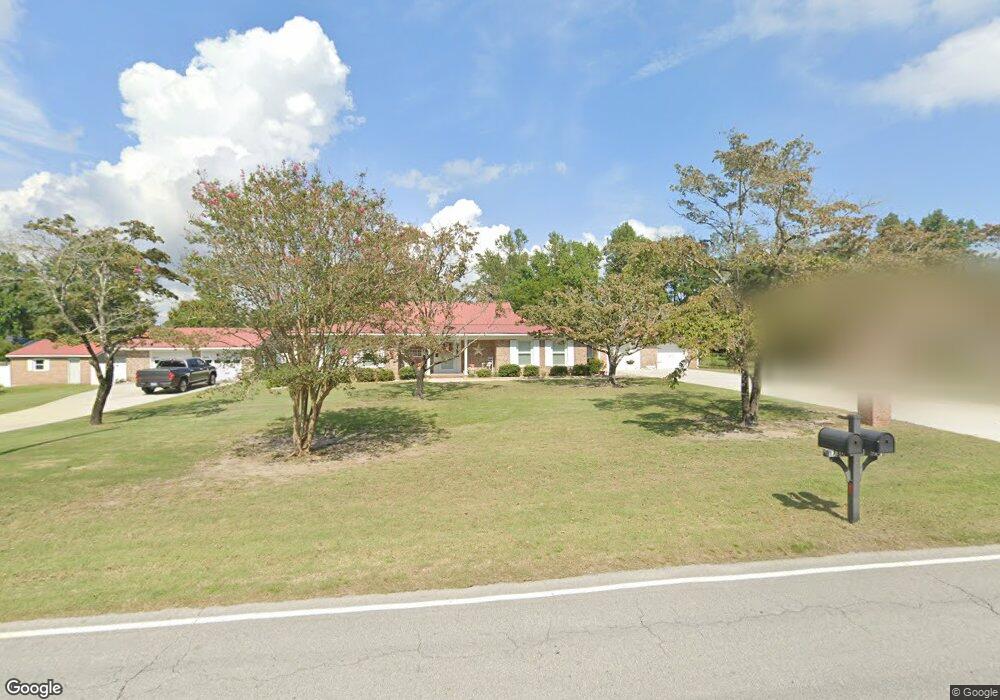
1731 Scotts Hill Loop Rd Wilmington, NC 28411
Estimated Value: $499,000 - $599,000
3
Beds
2
Baths
2,214
Sq Ft
$246/Sq Ft
Est. Value
About This Home
This home is located at 1731 Scotts Hill Loop Rd, Wilmington, NC 28411 and is currently estimated at $544,579, approximately $245 per square foot. 1731 Scotts Hill Loop Rd is a home located in Pender County with nearby schools including South Topsail Elementary School, Topsail Middle School, and Topsail High School.
Ownership History
Date
Name
Owned For
Owner Type
Purchase Details
Closed on
Mar 26, 2018
Sold by
Bobbitt Herbert Ryamond and Bobbitt Kathy W
Bought by
Bobbitt Herbert Raymond and Herbert And Kathy Bobbitt Living Trust
Current Estimated Value
Purchase Details
Closed on
May 10, 2007
Sold by
Ford Carol Sessoms
Bought by
Bobbitt Herbert Raymond and Bobbitt Kathy W
Home Financials for this Owner
Home Financials are based on the most recent Mortgage that was taken out on this home.
Original Mortgage
$140,000
Outstanding Balance
$84,878
Interest Rate
6.11%
Mortgage Type
New Conventional
Estimated Equity
$459,701
Purchase Details
Closed on
May 9, 2007
Sold by
Ford Carol Sessoms
Bought by
Bobbitt Herbert Raymond and Bobbitt Kathy W
Home Financials for this Owner
Home Financials are based on the most recent Mortgage that was taken out on this home.
Original Mortgage
$140,000
Outstanding Balance
$84,878
Interest Rate
6.11%
Mortgage Type
New Conventional
Estimated Equity
$459,701
Create a Home Valuation Report for This Property
The Home Valuation Report is an in-depth analysis detailing your home's value as well as a comparison with similar homes in the area
Home Values in the Area
Average Home Value in this Area
Purchase History
| Date | Buyer | Sale Price | Title Company |
|---|---|---|---|
| Bobbitt Herbert Raymond | -- | None Available | |
| Bobbitt Herbert Raymond | $314,000 | -- | |
| Bobbitt Herbert Raymond | $314,000 | -- |
Source: Public Records
Mortgage History
| Date | Status | Borrower | Loan Amount |
|---|---|---|---|
| Open | Bobbitt Herbert Raymond | $140,000 | |
| Closed | Bobbitt Herbert Raymond | $140,000 |
Source: Public Records
Tax History Compared to Growth
Tax History
| Year | Tax Paid | Tax Assessment Tax Assessment Total Assessment is a certain percentage of the fair market value that is determined by local assessors to be the total taxable value of land and additions on the property. | Land | Improvement |
|---|---|---|---|---|
| 2024 | $3,113 | $314,945 | $68,184 | $246,761 |
| 2023 | $3,113 | $314,945 | $68,184 | $246,761 |
| 2022 | $2,732 | $314,945 | $68,184 | $246,761 |
| 2021 | $2,732 | $314,945 | $68,184 | $246,761 |
| 2020 | $2,639 | $303,824 | $68,184 | $235,640 |
| 2019 | $2,639 | $303,824 | $68,184 | $235,640 |
| 2018 | $2,178 | $237,054 | $75,000 | $162,054 |
| 2017 | $2,178 | $237,054 | $75,000 | $162,054 |
| 2016 | $2,155 | $237,054 | $75,000 | $162,054 |
| 2015 | $2,230 | $237,054 | $75,000 | $162,054 |
| 2014 | $1,673 | $237,054 | $75,000 | $162,054 |
| 2013 | -- | $237,054 | $75,000 | $162,054 |
| 2012 | -- | $237,054 | $75,000 | $162,054 |
Source: Public Records
Map
Nearby Homes
- 112 Francis Marion Dr
- 348 Lafayette St
- 8707 Lowes Island Dr
- 216 La Salle St
- 8702 Thornblade Cir
- 424 Black Diamond Dr
- 111 Marshfield Dr
- 102 La Salle St
- 415 Sugar Cove Unit Lot 44
- 8404 Fazio Dr
- 571 Windstar Ln
- 8335 Vintage Club Cir
- 1279 Pandion Dr
- 704 Heart Pne Ave Unit Lot 52
- 335 Heart Pine Ave Unit Lot 99
- 623 Heart Pine Ave
- 0 Heart Pine Ave Unit 100543376
- 621 Wild Dunes Cir
- 54 Foundry Dr
- 10 Bowen Ct Unit Lot 53
- 1755 Scotts Hill Loop Rd
- 349 Scottsdale Dr
- 1691 Scotts Hill Loop Rd
- 345 Scottsdale Dr
- 353 Scottsdale Dr
- 1775 Scotts Hill Loop Rd
- 1730 Scotts Hill Loop Rd
- 341 Scottsdale Dr
- 1710 Scotts Hill Loop Rd
- 17 Narrow Way
- 110 Scottsdale Dr
- 1795 Scotts Hill Loop Rd
- 0 Narrow Way
- 11 Narrow Way
- Lot 17 Narrow Way
- Lot 13 Narrow Way
- Lot 15 Narrow Way
- Off Narrow Way
- Lot 13&14 Narrow Way
- 337 Scottsdale Dr