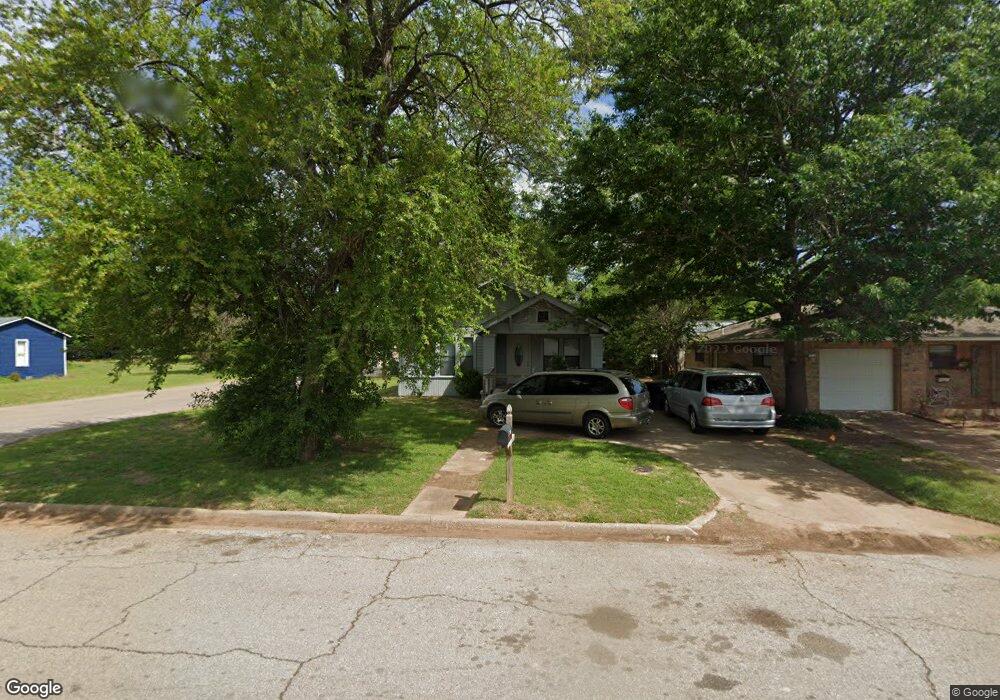
1731 W Bond St Denison, TX 75020
Estimated Value: $135,918 - $207,000
3
Beds
2
Baths
973
Sq Ft
$176/Sq Ft
Est. Value
About This Home
This home is located at 1731 W Bond St, Denison, TX 75020 and is currently estimated at $171,459, approximately $176 per square foot. 1731 W Bond St is a home located in Grayson County with nearby schools including Mayes Elementary School, Scott Middle School, and Denison High School.
Ownership History
Date
Name
Owned For
Owner Type
Purchase Details
Closed on
Feb 9, 2022
Sold by
Angel Ridge Properties Llc
Bought by
Watterson Blake
Current Estimated Value
Purchase Details
Closed on
Feb 8, 2022
Sold by
Angel Ridge Properties Llc
Bought by
Watterson Blake
Purchase Details
Closed on
Jul 26, 2011
Sold by
U S Bank National Association
Bought by
Angel Ridge Properties Llc
Purchase Details
Closed on
May 3, 2011
Sold by
Roberts Bruce and Roberts Carla
Bought by
U S Bank National Association
Purchase Details
Closed on
Jun 29, 2004
Sold by
Vining Robert and Vining David
Bought by
Roberts Bruce and Roberts Carla
Home Financials for this Owner
Home Financials are based on the most recent Mortgage that was taken out on this home.
Original Mortgage
$22,500
Interest Rate
6.3%
Mortgage Type
Purchase Money Mortgage
Create a Home Valuation Report for This Property
The Home Valuation Report is an in-depth analysis detailing your home's value as well as a comparison with similar homes in the area
Home Values in the Area
Average Home Value in this Area
Purchase History
| Date | Buyer | Sale Price | Title Company |
|---|---|---|---|
| Watterson Blake | -- | New Title Company Name | |
| Watterson Blake | -- | New Title Company Name | |
| Angel Ridge Properties Llc | -- | Lsi Title Agency Inc | |
| U S Bank National Association | $40,200 | None Available | |
| Roberts Bruce | -- | -- |
Source: Public Records
Mortgage History
| Date | Status | Borrower | Loan Amount |
|---|---|---|---|
| Previous Owner | Roberts Bruce | $22,500 |
Source: Public Records
Tax History Compared to Growth
Tax History
| Year | Tax Paid | Tax Assessment Tax Assessment Total Assessment is a certain percentage of the fair market value that is determined by local assessors to be the total taxable value of land and additions on the property. | Land | Improvement |
|---|---|---|---|---|
| 2025 | $2,703 | $111,752 | $43,125 | $68,627 |
| 2024 | $2,703 | $116,325 | $47,250 | $69,075 |
| 2023 | $2,414 | $106,554 | $40,875 | $65,679 |
| 2022 | $2,495 | $105,000 | $40,875 | $64,125 |
| 2021 | $2,008 | $79,612 | $20,250 | $59,362 |
| 2020 | $1,930 | $73,165 | $15,000 | $58,165 |
| 2019 | $2,168 | $78,803 | $12,450 | $66,353 |
| 2018 | $1,729 | $62,313 | $7,800 | $54,513 |
| 2017 | $2,051 | $73,297 | $6,975 | $66,322 |
| 2016 | $1,728 | $61,774 | $4,200 | $57,574 |
| 2015 | $1,880 | $66,561 | $3,150 | $63,411 |
| 2014 | $1,701 | $60,219 | $3,150 | $57,069 |
Source: Public Records
Map
Nearby Homes
- 1721 W Walker St Unit A and B
- 1601 W Bond St
- 2900 W Morton St
- 3130 W Morton St
- 3030 W Morton St
- 1700 W Morton St
- 3300 W Morton St
- 1905 W Morton St Unit 6
- 1905 W Morton St Unit 5
- 1905 W Morton St Unit 17
- 1905 W Morton St Unit 20
- 1905 W Morton St Unit 7
- 1915 W Bond St
- 916 Leeper Dr
- 1985 W Bond St
- 1505 W Johnson St
- 2021 W Walker St
- 727 W Parnell St
- 1609 W Woodard St
- TBD - W Washington St
- 1725 W Bond St
- 1723 W Bond St
- 1730 W Walker St
- 1722 W Walker St
- 1719 W Bond St
- 1805 W Bond St
- 1730 W Bond St
- 1728 W Bond St
- 1720 W Walker St
- 1711 W Bond St
- 1800 W Walker St
- 1716 W Walker St
- 1720 W Bond St
- 1800 W Bond St
- 1718 W Bond St
- 1710 W Walker St
- 1712 W Bond St
- 701 N Derby St
- 601 N Bush Ave Unit 603
- 1729 W Walker St