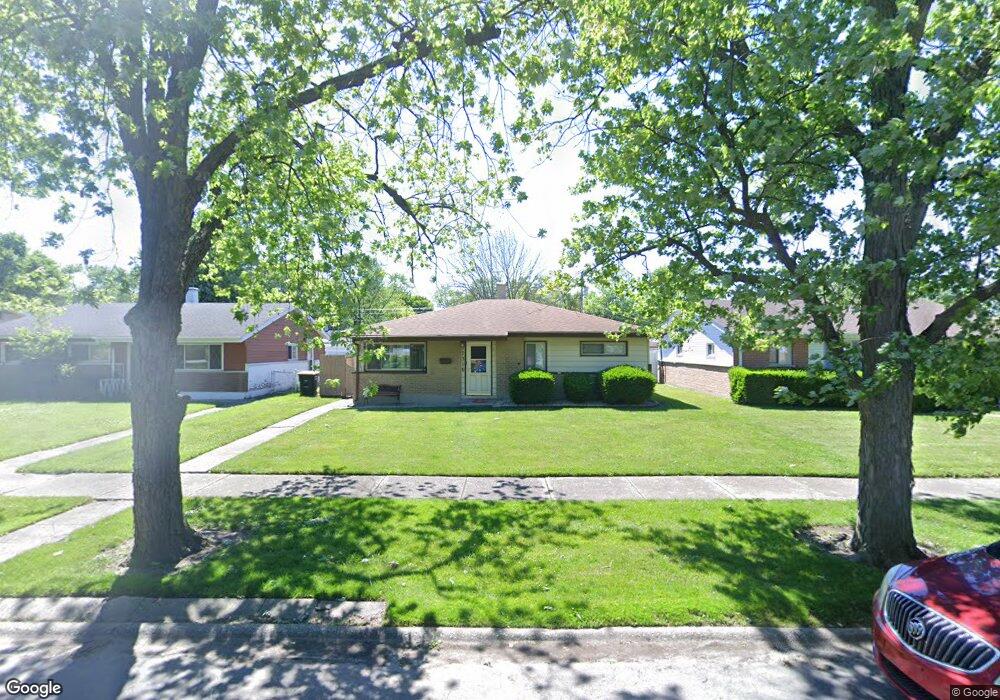
17310 Community St Lansing, IL 60438
Estimated Value: $161,514 - $192,000
3
Beds
1
Bath
1,147
Sq Ft
$156/Sq Ft
Est. Value
About This Home
This home is located at 17310 Community St, Lansing, IL 60438 and is currently estimated at $179,379, approximately $156 per square foot. 17310 Community St is a home located in Cook County with nearby schools including Reavis Elementary School, Memorial Jr High School, and Thornton Fractnl So High School.
Ownership History
Date
Name
Owned For
Owner Type
Purchase Details
Closed on
Nov 10, 2009
Sold by
Skold Ronald D and Skold Patricia A
Bought by
Skold Ronald and Skold Patricia
Current Estimated Value
Purchase Details
Closed on
Feb 28, 2003
Sold by
Schmidt David A and Schmidt Susan E
Bought by
Skold Ronald D and Skold Patricia A
Home Financials for this Owner
Home Financials are based on the most recent Mortgage that was taken out on this home.
Original Mortgage
$50,000
Outstanding Balance
$20,850
Interest Rate
5.96%
Estimated Equity
$158,529
Purchase Details
Closed on
Oct 2, 1995
Sold by
Taylor Timothy R and Taylor Debbie L
Bought by
Schmidt David A and Kopaczewski Susan E
Home Financials for this Owner
Home Financials are based on the most recent Mortgage that was taken out on this home.
Original Mortgage
$80,650
Interest Rate
7.65%
Mortgage Type
FHA
Create a Home Valuation Report for This Property
The Home Valuation Report is an in-depth analysis detailing your home's value as well as a comparison with similar homes in the area
Home Values in the Area
Average Home Value in this Area
Purchase History
| Date | Buyer | Sale Price | Title Company |
|---|---|---|---|
| Skold Ronald | -- | None Available | |
| Skold Ronald D | $90,000 | Pntn | |
| Schmidt David A | $81,000 | -- |
Source: Public Records
Mortgage History
| Date | Status | Borrower | Loan Amount |
|---|---|---|---|
| Open | Skold Ronald D | $50,000 | |
| Previous Owner | Schmidt David A | $80,650 |
Source: Public Records
Tax History
| Year | Tax Paid | Tax Assessment Tax Assessment Total Assessment is a certain percentage of the fair market value that is determined by local assessors to be the total taxable value of land and additions on the property. | Land | Improvement |
|---|---|---|---|---|
| 2025 | $5,322 | $11,000 | $2,480 | $8,520 |
| 2024 | $5,322 | $11,000 | $2,480 | $8,520 |
| 2023 | $5,126 | $11,000 | $2,480 | $8,520 |
| 2022 | $5,126 | $7,888 | $2,170 | $5,718 |
| 2021 | $4,986 | $7,887 | $2,170 | $5,717 |
| 2020 | $4,627 | $7,887 | $2,170 | $5,717 |
| 2019 | $4,726 | $8,301 | $2,015 | $6,286 |
| 2018 | $4,638 | $8,301 | $2,015 | $6,286 |
| 2017 | $4,683 | $8,301 | $2,015 | $6,286 |
| 2016 | $4,683 | $8,565 | $1,860 | $6,705 |
| 2015 | $4,352 | $8,565 | $1,860 | $6,705 |
| 2014 | $4,291 | $8,565 | $1,860 | $6,705 |
| 2013 | $4,237 | $9,409 | $1,860 | $7,549 |
Source: Public Records
Map
Nearby Homes
- 17303 Roy St
- 17333 Roy St
- 17335 Community St
- 17226 Community St
- 17318 Walter St
- 17423 Walter St
- 17153 Walter St
- 17132 Walter St
- 17519 Community St
- 17518 Roy St
- 17204 Bernadine St
- 3351 171st St
- 17244 Wentworth Ave
- 17552 Roy St
- 3069 Bernice Rd
- 17056 Burnham Ave
- 3061 Bernice Rd
- 3045 Bernice Rd
- 17614 Community St
- 3312 E 170th St
- 17314 Community St
- 17306 Community St
- 17302 Community St
- 17318 Community St
- 17311 Roy St
- 17307 Roy St
- 17322 Community St
- 17323 Roy St
- 17311 Community St
- 17307 Community St
- 17315 Community St
- 17326 Community St
- 17327 Roy St
- 17246 Community St
- 17303 Community St
- 17319 Community St
- 17323 Community St
- 17330 Community St
- 17255 Roy St
- 17242 Community St
Your Personal Tour Guide
Ask me questions while you tour the home.