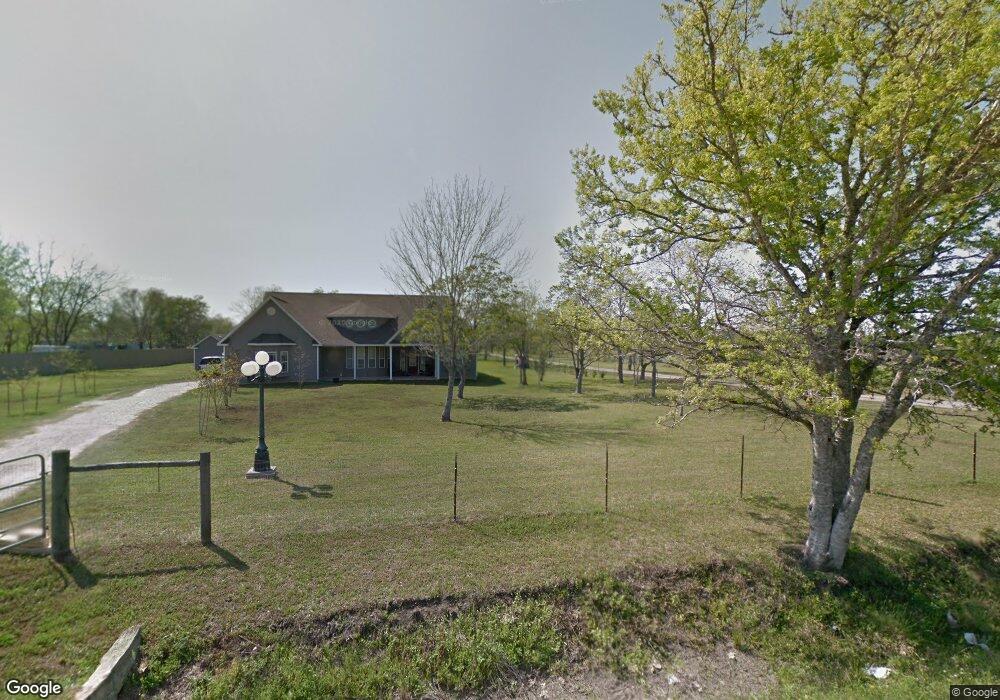
17310 N Wayne Ln Pearland, TX 77584
Estimated Value: $542,000 - $648,048
--
Bed
4
Baths
3,154
Sq Ft
$192/Sq Ft
Est. Value
About This Home
This home is located at 17310 N Wayne Ln, Pearland, TX 77584 and is currently estimated at $604,683, approximately $191 per square foot. 17310 N Wayne Ln is a home located in Brazoria County with nearby schools including Magnolia Elementary School, Pearland Junior High School South, and Sam Jamison Middle School.
Ownership History
Date
Name
Owned For
Owner Type
Purchase Details
Closed on
Aug 9, 2006
Sold by
Zakarevicz Devin and Zakarevicz Valerie
Bought by
Hollis Harlan and Hollis Julieann
Current Estimated Value
Home Financials for this Owner
Home Financials are based on the most recent Mortgage that was taken out on this home.
Original Mortgage
$155,230
Outstanding Balance
$93,147
Interest Rate
6.75%
Mortgage Type
Construction
Estimated Equity
$511,536
Purchase Details
Closed on
Nov 11, 2005
Sold by
Schell Daniel E
Bought by
Zakarevicz Devin and Zakarevicz Valerie
Purchase Details
Closed on
Jan 4, 2005
Sold by
Shelton Bernard Edwin and Shelton Sheryl Pate
Bought by
Schell Daniel E
Home Financials for this Owner
Home Financials are based on the most recent Mortgage that was taken out on this home.
Original Mortgage
$75,000
Interest Rate
5.74%
Mortgage Type
Purchase Money Mortgage
Create a Home Valuation Report for This Property
The Home Valuation Report is an in-depth analysis detailing your home's value as well as a comparison with similar homes in the area
Home Values in the Area
Average Home Value in this Area
Purchase History
| Date | Buyer | Sale Price | Title Company |
|---|---|---|---|
| Hollis Harlan | -- | American Title Company Pearl | |
| Zakarevicz Devin | -- | Chicago Title Pasadena | |
| Schell Daniel E | -- | Chicago Title Pasadena |
Source: Public Records
Mortgage History
| Date | Status | Borrower | Loan Amount |
|---|---|---|---|
| Open | Hollis Harlan | $155,230 | |
| Previous Owner | Schell Daniel E | $75,000 |
Source: Public Records
Tax History Compared to Growth
Tax History
| Year | Tax Paid | Tax Assessment Tax Assessment Total Assessment is a certain percentage of the fair market value that is determined by local assessors to be the total taxable value of land and additions on the property. | Land | Improvement |
|---|---|---|---|---|
| 2025 | $6,645 | $545,710 | $207,100 | $344,040 |
| 2023 | $6,645 | $451,000 | $241,620 | $317,720 |
| 2022 | $7,907 | $410,000 | $79,913 | $330,087 |
| 2021 | $7,474 | $382,000 | $97,390 | $284,610 |
| 2020 | $7,744 | $421,270 | $93,490 | $327,780 |
| 2019 | $7,158 | $359,780 | $93,490 | $266,290 |
| 2018 | $7,202 | $359,780 | $93,490 | $266,290 |
| 2017 | $7,151 | $368,000 | $101,290 | $266,710 |
| 2016 | $6,501 | $322,000 | $76,630 | $245,370 |
| 2015 | $5,776 | $315,000 | $62,630 | $252,370 |
| 2014 | $5,776 | $323,420 | $68,890 | $254,530 |
Source: Public Records
Map
Nearby Homes
- 6302 Amie Ln
- 6436 Grace Ln
- 17115 County Road 831
- 16708 N Wayne Ln
- 4805 Magnolia Springs Dr
- The Cedar (L412) Plan at Massey Oaks - Premier Series
- The Kessler (L454) Plan at Massey Oaks - Premier Series
- The Oleander (L401) Plan at Massey Oaks - Premier Series
- The Ian (L465) Plan at Massey Oaks - Premier Series
- The Henderson (L404) Plan at Massey Oaks - Premier Series
- The Preston (L403) Plan at Massey Oaks - Premier Series
- The Royal (L481) Plan at Massey Oaks - Premier Series
- The Callaghan (830) Plan at Massey Oaks - Premier Series
- 5030 Magnolia Springs Dr
- Southfork Plan at Massey Oaks
- Trinity Plan at Massey Oaks
- Yuma Plan at Massey Oaks
- Silverthorne Plan at Massey Oaks
- Rio Grande Plan at Massey Oaks
- Lavaca Plan at Massey Oaks
- Tract B Wayne Ln
- 17314 N Wayne Ln
- 17222 N Wayne Ln
- 17303 N Wayne Ln
- 17315 N Wayne Ln
- 6355 Tran Ln
- 6345 Tran Ln
- 17221 N Wayne Ln
- 6335 Tran Ln
- 6335 Tran Ln
- 00 Tran Ln
- 6344 Tran Ln
- 6354 Tran Ln
- 6334 Tran Ln
- 17321 N Wayne Ln
- 17400 N Wayne Ln
- 17130 N Wayne Ln
- 6314 Tran Ln
- 17335 N Wayne Ln
- 17217 N Wayne Ln