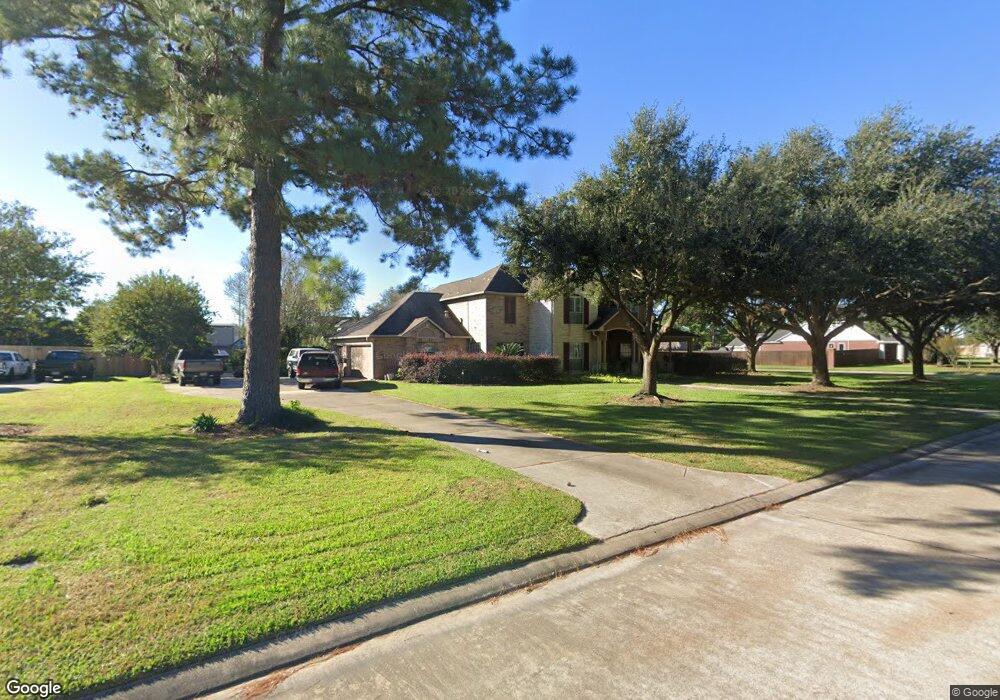
17311 E Single Rose Ct Cypress, TX 77429
Estimated Value: $713,000 - $812,000
4
Beds
4
Baths
3,541
Sq Ft
$212/Sq Ft
Est. Value
About This Home
This home is located at 17311 E Single Rose Ct, Cypress, TX 77429 and is currently estimated at $750,462, approximately $211 per square foot. 17311 E Single Rose Ct is a home located in Harris County with nearby schools including A. Robison Elementary School, Goodson Middle, and Cypress Woods High School.
Ownership History
Date
Name
Owned For
Owner Type
Purchase Details
Closed on
Apr 19, 2013
Sold by
Welch Joanne
Bought by
Kenig Kurt R and Keonig Kim K
Current Estimated Value
Home Financials for this Owner
Home Financials are based on the most recent Mortgage that was taken out on this home.
Original Mortgage
$245,000
Outstanding Balance
$173,796
Interest Rate
3.58%
Mortgage Type
New Conventional
Estimated Equity
$576,666
Purchase Details
Closed on
Aug 6, 2009
Sold by
Welch Dennis B and Welch Joanne
Bought by
Welch Joanne
Purchase Details
Closed on
Jun 22, 2000
Sold by
Centennial Homes Inc
Bought by
Welch Dennis B and Welch Joanne
Home Financials for this Owner
Home Financials are based on the most recent Mortgage that was taken out on this home.
Original Mortgage
$214,400
Interest Rate
8.66%
Create a Home Valuation Report for This Property
The Home Valuation Report is an in-depth analysis detailing your home's value as well as a comparison with similar homes in the area
Home Values in the Area
Average Home Value in this Area
Purchase History
| Date | Buyer | Sale Price | Title Company |
|---|---|---|---|
| Kenig Kurt R | -- | Stewart Title | |
| Welch Joanne | -- | None Available | |
| Welch Dennis B | -- | Chicago Title Insurance Co |
Source: Public Records
Mortgage History
| Date | Status | Borrower | Loan Amount |
|---|---|---|---|
| Open | Kenig Kurt R | $245,000 | |
| Previous Owner | Welch Dennis B | $214,400 |
Source: Public Records
Tax History Compared to Growth
Tax History
| Year | Tax Paid | Tax Assessment Tax Assessment Total Assessment is a certain percentage of the fair market value that is determined by local assessors to be the total taxable value of land and additions on the property. | Land | Improvement |
|---|---|---|---|---|
| 2025 | $7,972 | $713,300 | $161,251 | $552,049 |
| 2024 | $7,972 | $607,357 | $147,229 | $460,128 |
| 2023 | $7,972 | $735,600 | $147,229 | $588,371 |
| 2022 | $11,042 | $630,176 | $127,949 | $502,227 |
| 2021 | $10,558 | $504,931 | $127,949 | $376,982 |
| 2020 | $10,578 | $491,000 | $94,647 | $396,353 |
| 2019 | $11,162 | $499,285 | $68,356 | $430,929 |
| 2018 | $5,301 | $491,446 | $68,356 | $423,090 |
| 2017 | $10,990 | $491,446 | $68,356 | $423,090 |
| 2016 | $10,406 | $491,446 | $68,356 | $423,090 |
| 2015 | $6,800 | $467,365 | $68,356 | $399,009 |
| 2014 | $6,800 | $384,569 | $68,356 | $316,213 |
Source: Public Records
Map
Nearby Homes
- 17214 Huffmeister Rd
- 16710 Hasina Knoll Dr
- 16003 Roseview Ln
- 17631 Huffmeister Rd
- 16515 Nightingale Falls Ct
- 16503 Timberidge Ct
- 17859 Camp Cove Dr
- 17862 Camp Cove Dr
- 17926 Sugarloaf Bay Dr
- 16551 Cypress Bridge Dr
- 17407 W Blooming Rose Ct
- 17931 Sugarloaf Bay Dr
- 17922 Harbour Bridge Point Dr
- 18103 Blues Point Dr
- 14806 Cypress Timber Dr
- 17010 Cypress Knee Dr
- 17515 Cypress Orchard Ln
- 16703 Summer Cypress Ct
- 14710 Timber Cliff Ln
- 16106 Ladino Run St
- 17307 E Single Rose Ct
- 17403 W Single Rose Ct
- 17310 E Single Rose Ct
- 17303 E Single Rose Ct
- 17402 W Single Rose Ct
- 17306 E Single Rose Ct
- 17407 W Single Rose Ct
- 17302 E Single Rose Ct
- 17406 W Single Rose Ct
- 17411 W Single Rose Ct
- 17410 W Single Rose Ct
- 15802 Roseview Ln
- 15803 Roseview Ln
- 15810 Roseview Ln
- 17335 Hill Lakes Ct
- 17343 Hill Lakes Ct
- 14881 Skinner Rd
- 15811 Roseview Ln
- 17327 Hill Lakes Ct
- 15818 Roseview Ln