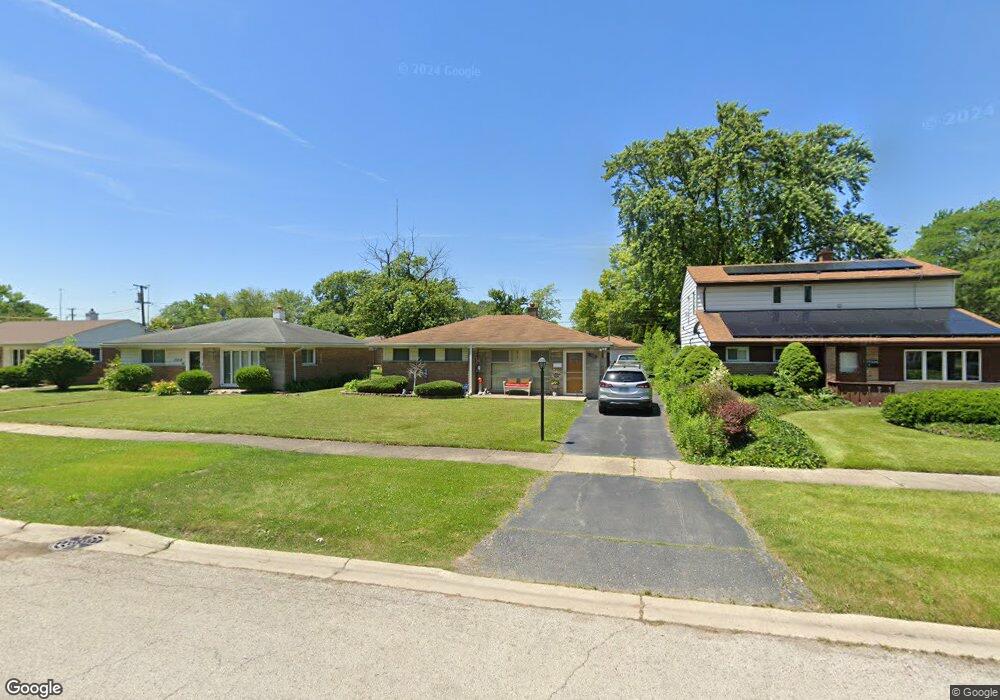
17312 Lorenz Ave Lansing, IL 60438
Estimated Value: $151,000 - $173,000
2
Beds
1
Bath
1,131
Sq Ft
$142/Sq Ft
Est. Value
About This Home
This home is located at 17312 Lorenz Ave, Lansing, IL 60438 and is currently estimated at $160,504, approximately $141 per square foot. 17312 Lorenz Ave is a home located in Cook County with nearby schools including Reavis Elementary School, Memorial Jr High School, and Thornton Fractnl So High School.
Ownership History
Date
Name
Owned For
Owner Type
Purchase Details
Closed on
Aug 24, 2001
Sold by
Biesboer Lori I and Biesboer Jennifer
Bought by
Scruggs Kelly
Current Estimated Value
Home Financials for this Owner
Home Financials are based on the most recent Mortgage that was taken out on this home.
Original Mortgage
$81,900
Interest Rate
6.99%
Purchase Details
Closed on
May 13, 1999
Sold by
Oconnor Kevin M
Bought by
Biesboer Lori I and Biesboer Jennifer
Home Financials for this Owner
Home Financials are based on the most recent Mortgage that was taken out on this home.
Original Mortgage
$61,600
Interest Rate
6.94%
Purchase Details
Closed on
Oct 9, 1995
Sold by
Stephens Gregg J and Stephens Laura J
Bought by
Oconnor Kevin M
Home Financials for this Owner
Home Financials are based on the most recent Mortgage that was taken out on this home.
Original Mortgage
$67,024
Interest Rate
7.8%
Mortgage Type
FHA
Create a Home Valuation Report for This Property
The Home Valuation Report is an in-depth analysis detailing your home's value as well as a comparison with similar homes in the area
Home Values in the Area
Average Home Value in this Area
Purchase History
| Date | Buyer | Sale Price | Title Company |
|---|---|---|---|
| Scruggs Kelly | $84,500 | -- | |
| Biesboer Lori I | $77,000 | -- | |
| Oconnor Kevin M | $69,000 | -- |
Source: Public Records
Mortgage History
| Date | Status | Borrower | Loan Amount |
|---|---|---|---|
| Previous Owner | Scruggs Kelly | $81,900 | |
| Previous Owner | Biesboer Lori I | $61,600 | |
| Previous Owner | Oconnor Kevin M | $67,024 |
Source: Public Records
Tax History Compared to Growth
Tax History
| Year | Tax Paid | Tax Assessment Tax Assessment Total Assessment is a certain percentage of the fair market value that is determined by local assessors to be the total taxable value of land and additions on the property. | Land | Improvement |
|---|---|---|---|---|
| 2024 | $3,234 | $10,000 | $2,500 | $7,500 |
| 2023 | $2,451 | $10,000 | $2,500 | $7,500 |
| 2022 | $2,451 | $7,192 | $2,188 | $5,004 |
| 2021 | $2,440 | $7,191 | $2,187 | $5,004 |
| 2020 | $2,399 | $7,191 | $2,187 | $5,004 |
| 2019 | $2,351 | $7,559 | $2,031 | $5,528 |
| 2018 | $2,304 | $7,559 | $2,031 | $5,528 |
| 2017 | $2,361 | $7,559 | $2,031 | $5,528 |
| 2016 | $2,125 | $6,383 | $1,875 | $4,508 |
| 2015 | $1,910 | $6,383 | $1,875 | $4,508 |
| 2014 | $1,911 | $6,383 | $1,875 | $4,508 |
| 2013 | $2,267 | $7,665 | $1,875 | $5,790 |
Source: Public Records
Map
Nearby Homes
- 17303 Chicago Ave
- 3026 Bernice Rd Unit 308
- 3127 Bernice Rd Unit 2
- 3127 Bernice Rd Unit 6
- 2950 Bernice Rd
- 17318 Walter St
- 17157 Chicago Ave
- 3425 Bernice Ave
- 17415 Burnham Ave
- 17137 Greenbay Ave
- 17130 Park Ave
- 17138 Burnham Ave
- 17153 Burnham Ave
- 17419 Walter St
- 17157 Walter St
- 17153 Walter St
- 17132 Walter St
- 17317 Roy St
- 17303 Roy St
- 17048 Lorenz Ave
- 17306 Lorenz Ave
- 17318 Lorenz Ave
- 17322 Lorenz Ave
- 17302 Lorenz Ave
- 17313 Park Ave
- 17307 Park Ave
- 17326 Lorenz Ave
- 17319 Park Ave
- 17323 Park Ave
- 17303 Park Ave
- 17313 Lorenz Ave
- 17319 Lorenz Ave
- 17307 Lorenz Ave
- 17332 Lorenz Ave
- 17325 Park Ave
- 17323 Lorenz Ave
- 17303 Lorenz Ave
- 17256 Lorenz Ave
- 17329 Park Ave
- 17327 Lorenz Ave