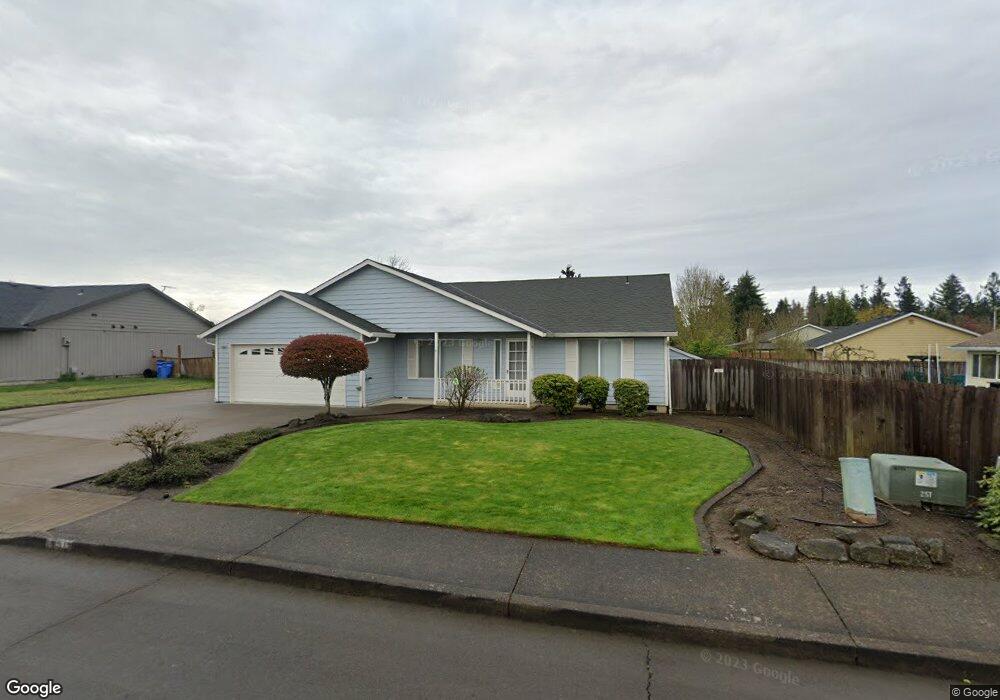
17317 NE 8th St Vancouver, WA 98684
Mill Plain NeighborhoodEstimated Value: $532,000 - $604,620
3
Beds
2
Baths
1,840
Sq Ft
$312/Sq Ft
Est. Value
About This Home
This home is located at 17317 NE 8th St, Vancouver, WA 98684 and is currently estimated at $574,655, approximately $312 per square foot. 17317 NE 8th St is a home located in Clark County with nearby schools including Illahee Elementary School, Shahala Middle School, and Union High School.
Ownership History
Date
Name
Owned For
Owner Type
Purchase Details
Closed on
Dec 13, 2004
Sold by
Nichols James T
Bought by
Krajcar David S and Krajcar Carol N
Current Estimated Value
Home Financials for this Owner
Home Financials are based on the most recent Mortgage that was taken out on this home.
Original Mortgage
$249,750
Outstanding Balance
$124,825
Interest Rate
5.7%
Mortgage Type
Purchase Money Mortgage
Estimated Equity
$449,830
Purchase Details
Closed on
Dec 7, 2004
Sold by
Nichols Robert M and Nichols Claudia A
Bought by
Nichols James T
Home Financials for this Owner
Home Financials are based on the most recent Mortgage that was taken out on this home.
Original Mortgage
$249,750
Outstanding Balance
$124,825
Interest Rate
5.7%
Mortgage Type
Purchase Money Mortgage
Estimated Equity
$449,830
Purchase Details
Closed on
Jan 8, 1997
Sold by
Nichols Robert M and Nichols Claudia A
Bought by
Nichols James T
Home Financials for this Owner
Home Financials are based on the most recent Mortgage that was taken out on this home.
Original Mortgage
$115,156
Interest Rate
6%
Purchase Details
Closed on
May 16, 1996
Sold by
Orr Robert W and Orr Lisa M
Bought by
Nichols Robert M and Nichols Claudia A
Create a Home Valuation Report for This Property
The Home Valuation Report is an in-depth analysis detailing your home's value as well as a comparison with similar homes in the area
Home Values in the Area
Average Home Value in this Area
Purchase History
| Date | Buyer | Sale Price | Title Company |
|---|---|---|---|
| Krajcar David S | $277,500 | Chicago Title Insurance | |
| Nichols James T | -- | Chicago Title Insurance | |
| Nichols James T | $115,156 | Clark County Title Company | |
| Nichols Robert M | $134,498 | Clark County Title |
Source: Public Records
Mortgage History
| Date | Status | Borrower | Loan Amount |
|---|---|---|---|
| Open | Krajcar David S | $249,750 | |
| Previous Owner | Nichols James T | $115,156 |
Source: Public Records
Tax History Compared to Growth
Tax History
| Year | Tax Paid | Tax Assessment Tax Assessment Total Assessment is a certain percentage of the fair market value that is determined by local assessors to be the total taxable value of land and additions on the property. | Land | Improvement |
|---|---|---|---|---|
| 2025 | $5,455 | $545,811 | $213,500 | $332,311 |
| 2024 | $5,336 | $539,096 | $213,500 | $325,596 |
| 2023 | $5,236 | $552,993 | $213,500 | $339,493 |
| 2022 | $4,779 | $534,174 | $205,875 | $328,299 |
| 2021 | $4,436 | $454,047 | $173,850 | $280,197 |
| 2020 | $4,294 | $396,345 | $152,500 | $243,845 |
| 2019 | $3,836 | $385,235 | $135,100 | $250,135 |
| 2018 | $4,090 | $371,451 | $0 | $0 |
| 2017 | $3,776 | $319,294 | $0 | $0 |
| 2016 | $3,577 | $307,243 | $0 | $0 |
| 2015 | $3,418 | $270,983 | $0 | $0 |
| 2014 | -- | $246,368 | $0 | $0 |
| 2013 | -- | $198,078 | $0 | $0 |
Source: Public Records
Map
Nearby Homes
- 17006 NE 6th St
- 419 NE 169th Ave
- 221 NE 176th Ave
- 16715 NE 5th St
- 212 NE 175th Ave
- 1111 NE 171st Ct
- 16812 SE 1st St Unit 80
- 16812 SE 1st St Unit 74
- 16812 SE 1st St Unit 60
- 16812 SE 1st St Unit 71
- 16812 SE 1st St Unit 69
- 16812 SE 1st St Unit 84
- 16812 SE 1st St Unit 67
- 16500 SE 1st St
- 16500 SE 1st St Unit 98
- 16500 SE 1st St Unit 68
- 16500 SE 1st St Unit 170
- 16500 SE 1st St Unit 14
- 16500 SE 1st St Unit 56
- 16500 SE 1st St Unit 20
- 17403 NE 8th St
- 719 NE 173rd Ave
- 715 NE 173rd Ave
- 17312 NE 7th St
- 17318 NE 7th St
- 720 NE 175th Ave
- 709 NE 173rd Ave
- 712 NE 175th Ave
- 704 NE 175th Ave
- 718 NE 173rd Ave
- 707 NE 172nd Ave
- 17309 NE 7th St
- 17319 NE 7th St
- 706 NE 173rd Ave
- 721 NE 175th Ave
- 711 NE 175th Ave
- 17301 NE 7th St
- 17411 NE 7th St
- 703 NE 175th Ave
- 700 NE 173rd Ave