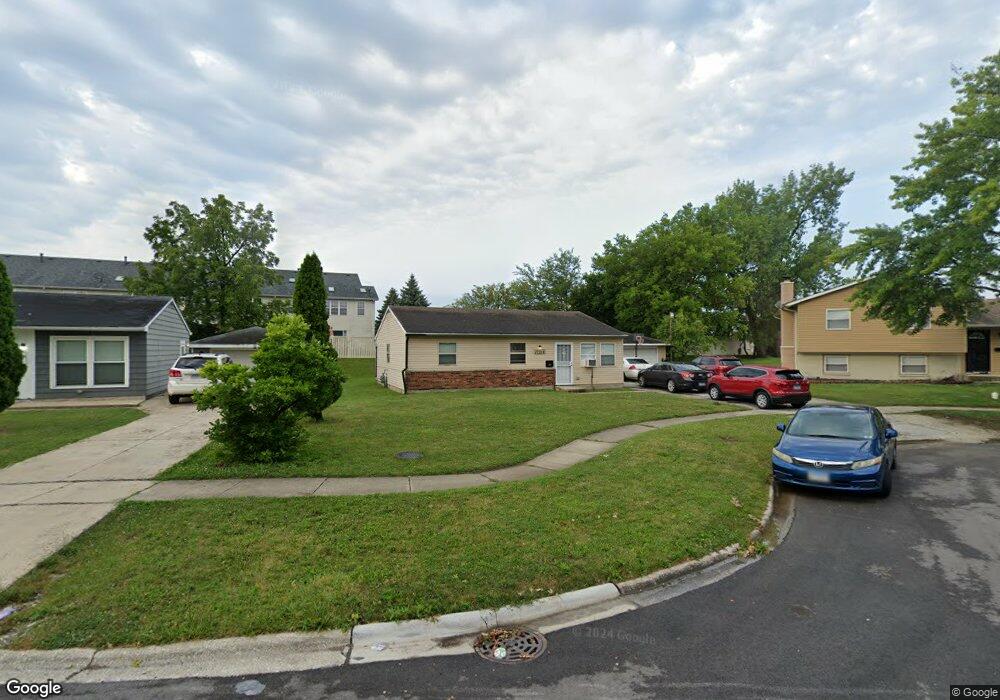
17318 Peach Grove Ln Hazel Crest, IL 60429
Estimated Value: $131,000 - $172,100
3
Beds
1
Bath
1,034
Sq Ft
$152/Sq Ft
Est. Value
About This Home
This home is located at 17318 Peach Grove Ln, Hazel Crest, IL 60429 and is currently estimated at $156,775, approximately $151 per square foot. 17318 Peach Grove Ln is a home located in Cook County with nearby schools including Highlands Elementary School, Prairie-Hills Junior High School, and Hillcrest High School.
Ownership History
Date
Name
Owned For
Owner Type
Purchase Details
Closed on
Jun 23, 2015
Sold by
Gasik Richard S
Bought by
First Community Bank & Trust and Trust #2015 0168
Current Estimated Value
Purchase Details
Closed on
Jul 20, 2009
Sold by
Household Finance Corporation Iii
Bought by
Gasik Richard S
Purchase Details
Closed on
Jun 15, 2009
Sold by
James Sonja
Bought by
Household Finance Corporation Iii
Purchase Details
Closed on
Oct 31, 2006
Sold by
James Daily
Bought by
James Daily and James Sonja
Home Financials for this Owner
Home Financials are based on the most recent Mortgage that was taken out on this home.
Original Mortgage
$103,500
Interest Rate
8.99%
Mortgage Type
Unknown
Purchase Details
Closed on
Mar 16, 2000
Sold by
Kampstra Mary L
Bought by
James Daily
Home Financials for this Owner
Home Financials are based on the most recent Mortgage that was taken out on this home.
Original Mortgage
$59,400
Interest Rate
11.32%
Create a Home Valuation Report for This Property
The Home Valuation Report is an in-depth analysis detailing your home's value as well as a comparison with similar homes in the area
Home Values in the Area
Average Home Value in this Area
Purchase History
| Date | Buyer | Sale Price | Title Company |
|---|---|---|---|
| First Community Bank & Trust | -- | None Available | |
| Gasik Richard S | $20,000 | Forum Title Insurance Co | |
| Household Finance Corporation Iii | -- | None Available | |
| James Daily | -- | First American Title Ins Co | |
| James Daily | -- | -- |
Source: Public Records
Mortgage History
| Date | Status | Borrower | Loan Amount |
|---|---|---|---|
| Previous Owner | James Daily | $103,500 | |
| Previous Owner | James Daily | $59,400 |
Source: Public Records
Tax History Compared to Growth
Tax History
| Year | Tax Paid | Tax Assessment Tax Assessment Total Assessment is a certain percentage of the fair market value that is determined by local assessors to be the total taxable value of land and additions on the property. | Land | Improvement |
|---|---|---|---|---|
| 2024 | $6,147 | $12,000 | $2,527 | $9,473 |
| 2023 | $5,856 | $12,000 | $2,527 | $9,473 |
| 2022 | $5,856 | $7,977 | $2,166 | $5,811 |
| 2021 | $5,644 | $7,977 | $2,166 | $5,811 |
| 2020 | $5,810 | $8,649 | $2,166 | $6,483 |
| 2019 | $4,998 | $7,465 | $1,985 | $5,480 |
| 2018 | $4,844 | $7,465 | $1,985 | $5,480 |
| 2017 | $5,209 | $8,592 | $1,985 | $6,607 |
| 2016 | $4,863 | $8,318 | $1,805 | $6,513 |
| 2015 | $3,190 | $8,318 | $1,805 | $6,513 |
| 2014 | $3,141 | $8,318 | $1,805 | $6,513 |
| 2013 | $3,026 | $8,948 | $1,805 | $7,143 |
Source: Public Records
Map
Nearby Homes
- 17304 Peach Grove Ln
- 17511 Winston Dr Unit 1
- 17303 Appletree Dr
- 3806 172nd St
- 3740 Highland Place
- 17126 Orchard Ln
- 4101 Park Ln Unit 1
- 7R2 Country Club Ln
- 7R Country Club Ln
- 17700 Springfield Ave
- 17651 Hillcrest Dr
- 3881 171st St
- 17640 Central Park Ave
- 17115 Magnolia Dr
- 3512 Woodworth Place
- 17110 Apple Tree Dr
- 17721 Sarah Ln
- 17109 Magnolia Dr
- 17548 Chestnut Ave
- 17700 Oakwood Ave
- 17320 Peach Grove Ln
- 17316 Peach Grove Ln
- 17400 Westminster Ave Unit 174
- 17410 Westminster Ave Unit 174
- 3830 Westminster Ave Unit 1
- 3830 Westminster Ave Unit 3830
- 17420 Westminster Ave Unit 174
- 17314 Peach Grove Ln
- 17430 Westminster Ave Unit 174
- 3713 Glynwood Ln
- 3820 Westminster Ave Unit 3820
- 3810 Westminster Ave Unit 3810
- 3810 Westminster Ave Unit 1
- 3800 Westminster Ave Unit 3800
- 17311 Peach Grove Ln
- 17312 Peach Grove Ln
- 3711 Glynwood Ln
- 3712 Glynwood Ln
- 17309 Peach Grove Ln
- 3720 Westminster Ave Unit 3720