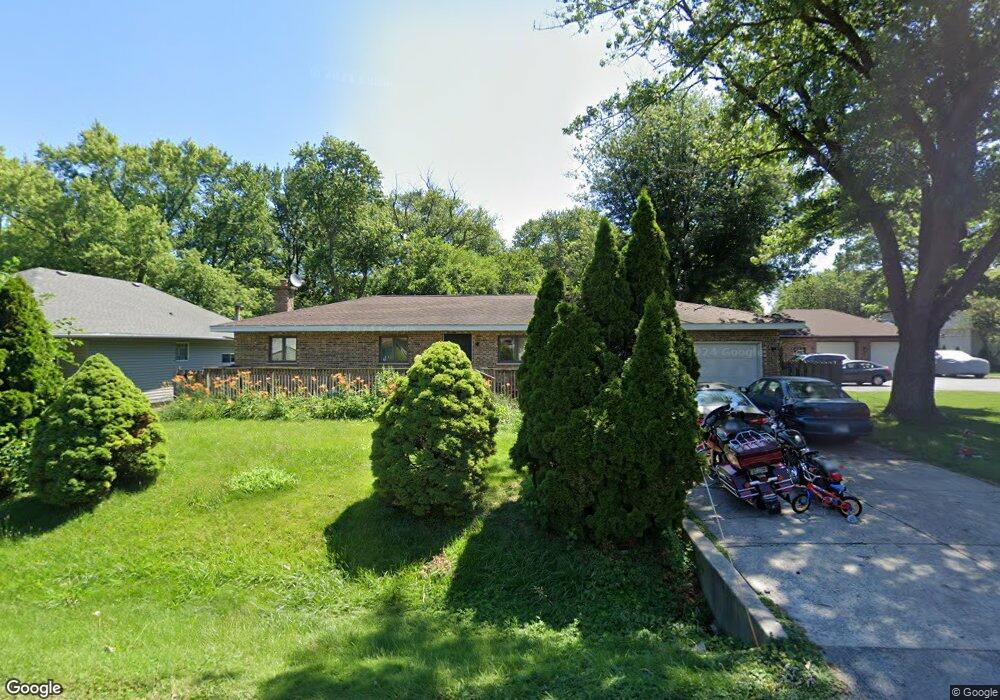
17319 Laflin Ave Hazel Crest, IL 60429
Estimated Value: $141,000 - $162,000
2
Beds
1
Bath
976
Sq Ft
$158/Sq Ft
Est. Value
About This Home
This home is located at 17319 Laflin Ave, Hazel Crest, IL 60429 and is currently estimated at $154,044, approximately $157 per square foot. 17319 Laflin Ave is a home located in Cook County with nearby schools including Thornwood High School.
Ownership History
Date
Name
Owned For
Owner Type
Purchase Details
Closed on
Aug 26, 1993
Sold by
Haase Robert J
Bought by
Poya Mark A and Poya Lisa L
Current Estimated Value
Home Financials for this Owner
Home Financials are based on the most recent Mortgage that was taken out on this home.
Original Mortgage
$86,150
Interest Rate
7.22%
Mortgage Type
FHA
Create a Home Valuation Report for This Property
The Home Valuation Report is an in-depth analysis detailing your home's value as well as a comparison with similar homes in the area
Home Values in the Area
Average Home Value in this Area
Purchase History
| Date | Buyer | Sale Price | Title Company |
|---|---|---|---|
| Poya Mark A | $57,333 | -- |
Source: Public Records
Mortgage History
| Date | Status | Borrower | Loan Amount |
|---|---|---|---|
| Closed | Poya Mark A | $86,150 |
Source: Public Records
Tax History Compared to Growth
Tax History
| Year | Tax Paid | Tax Assessment Tax Assessment Total Assessment is a certain percentage of the fair market value that is determined by local assessors to be the total taxable value of land and additions on the property. | Land | Improvement |
|---|---|---|---|---|
| 2024 | $4,045 | $11,100 | $2,035 | $9,065 |
| 2023 | $1,320 | $11,100 | $2,035 | $9,065 |
| 2022 | $1,320 | $5,449 | $2,713 | $2,736 |
| 2021 | $1,353 | $5,449 | $2,713 | $2,736 |
| 2020 | $1,438 | $5,449 | $2,713 | $2,736 |
| 2019 | $2,445 | $7,518 | $2,487 | $5,031 |
| 2018 | $2,415 | $7,518 | $2,487 | $5,031 |
| 2017 | $2,462 | $7,518 | $2,487 | $5,031 |
| 2016 | $3,409 | $8,572 | $2,261 | $6,311 |
| 2015 | $3,228 | $8,572 | $2,261 | $6,311 |
| 2014 | $3,195 | $8,572 | $2,261 | $6,311 |
| 2013 | $3,335 | $9,419 | $2,261 | $7,158 |
Source: Public Records
Map
Nearby Homes
- 17231 Laflin Ave
- 1514 173rd St
- 1314 174th St
- 1409 172nd St
- 1411 172nd St
- 1321 172nd St
- 17406 Throop St
- 1100 173rd St
- 17212 Hawthorne Dr
- 1113 171st St
- 17222 Country Ln
- 1025 171st St
- 17304 Lathrop Ave
- 1903 171st St
- 1001 172nd St
- 17308 Forestway Dr
- 1848 172nd St
- 16929 Wood St
- 1725 Cedar Rd
- 16919 Wood St
- 17311 Laflin Ave
- 17321 Laflin Ave
- 17309 Laflin Ave
- 1424 174th St
- 17318 Laflin Ave
- 17316 Laflin Ave
- 1428 174th St
- 17314 Laflin Ave
- 1419 173rd St
- 1414 174th St
- 17301 Laflin Ave
- 17320 Laflin Ave
- 17326 Laflin Ave
- 1412 174th St
- 17322 Laflin Ave
- 1423 173rd St
- 1413 173rd St
- 17310 Laflin Ave
- 17300 Laflin Ave
- 1408 174th St