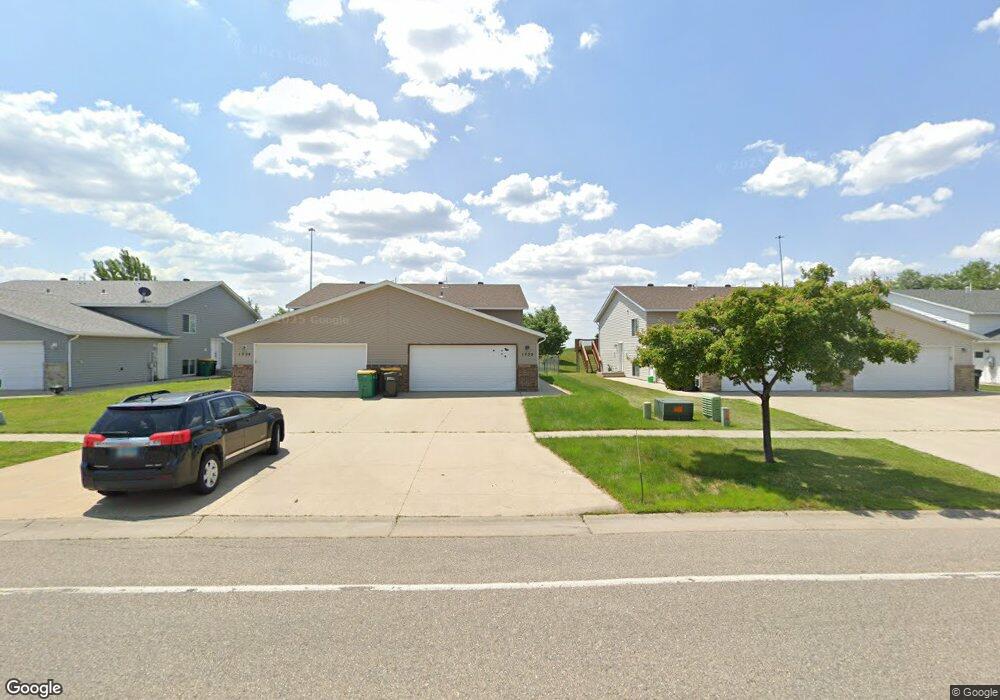
1732 10th St W West Fargo, ND 58078
Elmwood Court NeighborhoodEstimated Value: $266,000 - $286,042
3
Beds
2
Baths
1,672
Sq Ft
$165/Sq Ft
Est. Value
About This Home
This home is located at 1732 10th St W, West Fargo, ND 58078 and is currently estimated at $276,021, approximately $165 per square foot. 1732 10th St W is a home located in Cass County with nearby schools including Westside Elementary School, Cheney Middle School, and West Fargo High School.
Ownership History
Date
Name
Owned For
Owner Type
Purchase Details
Closed on
Mar 10, 2005
Sold by
Ltd Corp
Bought by
Hendrickson Lean
Current Estimated Value
Home Financials for this Owner
Home Financials are based on the most recent Mortgage that was taken out on this home.
Original Mortgage
$97,143
Interest Rate
6%
Mortgage Type
Adjustable Rate Mortgage/ARM
Create a Home Valuation Report for This Property
The Home Valuation Report is an in-depth analysis detailing your home's value as well as a comparison with similar homes in the area
Home Values in the Area
Average Home Value in this Area
Purchase History
| Date | Buyer | Sale Price | Title Company |
|---|---|---|---|
| Hendrickson Lean | -- | -- |
Source: Public Records
Mortgage History
| Date | Status | Borrower | Loan Amount |
|---|---|---|---|
| Closed | Hendrickson Lean | $92,500 | |
| Previous Owner | Hendrickson Lean | $97,143 |
Source: Public Records
Tax History Compared to Growth
Tax History
| Year | Tax Paid | Tax Assessment Tax Assessment Total Assessment is a certain percentage of the fair market value that is determined by local assessors to be the total taxable value of land and additions on the property. | Land | Improvement |
|---|---|---|---|---|
| 2024 | $2,987 | $117,000 | $19,550 | $97,450 |
| 2023 | $3,404 | $113,900 | $19,550 | $94,350 |
| 2022 | $3,266 | $104,200 | $19,550 | $84,650 |
| 2021 | $3,202 | $94,800 | $15,650 | $79,150 |
| 2020 | $3,030 | $91,150 | $15,650 | $75,500 |
| 2019 | $2,832 | $88,550 | $15,650 | $72,900 |
| 2018 | $2,731 | $88,550 | $15,650 | $72,900 |
| 2017 | $2,604 | $85,700 | $15,650 | $70,050 |
| 2016 | $2,327 | $82,950 | $15,650 | $67,300 |
| 2015 | $2,164 | $69,550 | $5,050 | $64,500 |
| 2014 | $2,134 | $65,000 | $5,050 | $59,950 |
| 2013 | $2,024 | $63,250 | $5,050 | $58,200 |
Source: Public Records
Map
Nearby Homes