1732 13th St Wyandotte, MI 48192
Estimated Value: $179,208 - $220,000
--
Bed
--
Bath
1,060
Sq Ft
$191/Sq Ft
Est. Value
About This Home
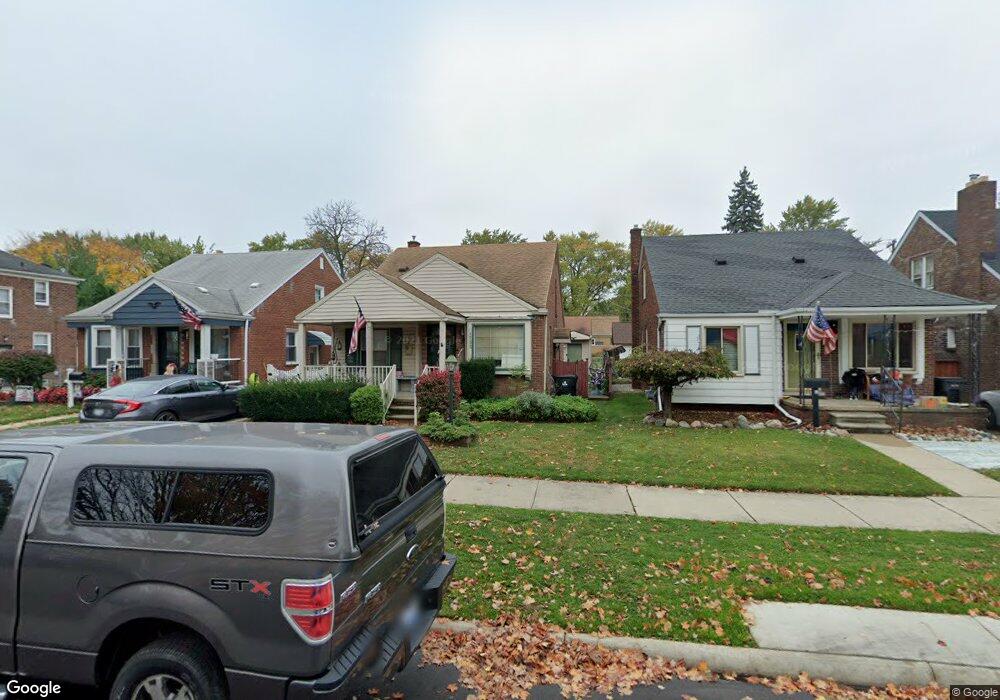
This home is located at 1732 13th St, Wyandotte, MI 48192 and is currently estimated at $202,302, approximately $190 per square foot. 1732 13th St is a home located in Wayne County with nearby schools including Jefferson Elementary School, Woodrow Wilson School, and Roosevelt High School.
Ownership History
Date
Name
Owned For
Owner Type
Purchase Details
Closed on
Feb 27, 2016
Sold by
Fortune Marsha L and Fortune Dennis
Bought by
Fortune Dennis and Fortune Marsha L
Current Estimated Value
Home Financials for this Owner
Home Financials are based on the most recent Mortgage that was taken out on this home.
Original Mortgage
$80,000
Outstanding Balance
$34,734
Interest Rate
3.81%
Mortgage Type
New Conventional
Estimated Equity
$167,568
Purchase Details
Closed on
Jun 5, 1995
Sold by
Busha Gerald T
Bought by
Dale F and Kozan Marsha L
Create a Home Valuation Report for This Property
The Home Valuation Report is an in-depth analysis detailing your home's value as well as a comparison with similar homes in the area
Home Values in the Area
Average Home Value in this Area
Purchase History
| Date | Buyer | Sale Price | Title Company |
|---|---|---|---|
| Fortune Dennis | -- | Title365 | |
| Dale F | $95,000 | -- |
Source: Public Records
Mortgage History
| Date | Status | Borrower | Loan Amount |
|---|---|---|---|
| Open | Fortune Dennis | $80,000 |
Source: Public Records
Tax History Compared to Growth
Tax History
| Year | Tax Paid | Tax Assessment Tax Assessment Total Assessment is a certain percentage of the fair market value that is determined by local assessors to be the total taxable value of land and additions on the property. | Land | Improvement |
|---|---|---|---|---|
| 2025 | $2,077 | $90,000 | $0 | $0 |
| 2024 | $2,077 | $83,000 | $0 | $0 |
| 2023 | $1,981 | $75,600 | $0 | $0 |
| 2022 | $2,295 | $67,000 | $0 | $0 |
| 2021 | $2,249 | $59,800 | $0 | $0 |
| 2020 | $2,218 | $53,500 | $0 | $0 |
| 2019 | $2,187 | $49,300 | $0 | $0 |
| 2018 | $1,746 | $47,300 | $0 | $0 |
| 2017 | $765 | $47,300 | $0 | $0 |
| 2016 | $2,112 | $43,000 | $0 | $0 |
| 2015 | $3,768 | $39,900 | $0 | $0 |
| 2013 | $3,650 | $36,500 | $0 | $0 |
| 2012 | $1,724 | $38,200 | $5,800 | $32,400 |
Source: Public Records
Map
Nearby Homes