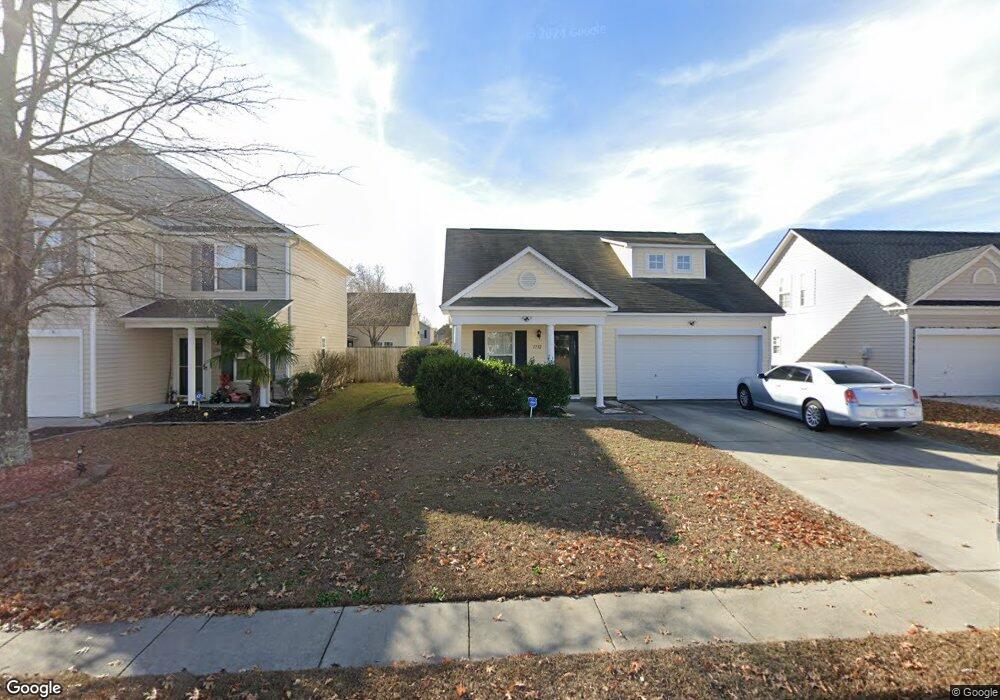
1732 Benelli St Sumter, SC 29150
Estimated Value: $202,000 - $237,000
3
Beds
3
Baths
1,374
Sq Ft
$157/Sq Ft
Est. Value
About This Home
This home is located at 1732 Benelli St, Sumter, SC 29150 and is currently estimated at $215,615, approximately $156 per square foot. 1732 Benelli St is a home located in Sumter County with nearby schools including Oakland Primary School, High Hills Elementary School, and Shaw Heights Elementary School.
Ownership History
Date
Name
Owned For
Owner Type
Purchase Details
Closed on
May 10, 2019
Sold by
Baker Joseph D and Baker Breanna Kristine
Bought by
Price Jayson M
Current Estimated Value
Home Financials for this Owner
Home Financials are based on the most recent Mortgage that was taken out on this home.
Original Mortgage
$126,373
Outstanding Balance
$111,327
Interest Rate
4.5%
Mortgage Type
FHA
Estimated Equity
$104,288
Purchase Details
Closed on
Apr 28, 2017
Sold by
Richard Maurice J and Richard Kum S
Bought by
Baker Joseph D and Baker Breanna Kristine
Home Financials for this Owner
Home Financials are based on the most recent Mortgage that was taken out on this home.
Original Mortgage
$122,427
Interest Rate
4.3%
Mortgage Type
VA
Purchase Details
Closed on
Jul 22, 2013
Sold by
Finch Michael S and Finch Katie
Bought by
Richard Maurice J and Richard Kum S
Create a Home Valuation Report for This Property
The Home Valuation Report is an in-depth analysis detailing your home's value as well as a comparison with similar homes in the area
Purchase History
| Date | Buyer | Sale Price | Title Company |
|---|---|---|---|
| Price Jayson M | $135,000 | None Available | |
| Baker Joseph D | $119,000 | None Available | |
| Richard Maurice J | $110,500 | -- |
Source: Public Records
Mortgage History
| Date | Status | Borrower | Loan Amount |
|---|---|---|---|
| Open | Price Jayson M | $126,373 | |
| Closed | Price Jayson M | $15,000 | |
| Previous Owner | Baker Joseph D | $122,427 |
Source: Public Records
Tax History
| Year | Tax Paid | Tax Assessment Tax Assessment Total Assessment is a certain percentage of the fair market value that is determined by local assessors to be the total taxable value of land and additions on the property. | Land | Improvement |
|---|---|---|---|---|
| 2025 | $948 | $5,010 | $800 | $4,210 |
| 2024 | $948 | $5,010 | $800 | $4,210 |
| 2023 | $948 | $5,010 | $800 | $4,210 |
| 2022 | $943 | $5,010 | $800 | $4,210 |
| 2021 | $941 | $5,010 | $800 | $4,210 |
| 2020 | $975 | $4,880 | $840 | $4,040 |
| 2019 | $886 | $4,450 | $840 | $3,610 |
| 2018 | $854 | $4,450 | $840 | $3,610 |
| 2017 | $915 | $4,690 | $1,000 | $3,690 |
| 2016 | $928 | $4,690 | $1,000 | $3,690 |
| 2015 | $923 | $4,500 | $920 | $3,580 |
| 2014 | $923 | $4,500 | $920 | $3,580 |
| 2013 | -- | $4,410 | $760 | $3,650 |
Source: Public Records
Map
Nearby Homes
- 1749 Polaris Dr
- 1766 Polaris Dr
- 2790 Magnum Dr
- 1808 Polaris Dr
- 1752 Musket Trail
- 1751 Canopy Dr
- 1757 Canopy Dr
- 1763 Canopy Dr
- 1769 Canopy Dr
- 2895 Old Field Rd
- 1754 Canopy Dr
- 1766 Canopy Dr
- 1772 Canopy Dr
- 2801 Broad St
- 1853 Payne Dr
- 1862 Gabriel Ln
- 1924 Flagpole Dr
- 2345 Daylily St Unit 143
- 2291 Citation St
- 2225 Citation St Unit 8
- 1732 Benelli St
- 1724 Benelli St
- 1724 Benelli St
- 1740 Benelli St
- 1716 Benelli St
- 1743 Polaris Dr
- 1716 Benelli St
- 1748 Benelli St
- 1737 Polaris Dr
- 1731 Polaris Dr
- 1755 Polaris Dr
- 1708 Benelli St
- 1756 Benelli St
- 1756 Benelli St
- 1725 Benelli St
- 1733 Benelli St
- 1756 Benelli St
- 1717 Benelli St
- 1725 Polaris Dr
- 1761 Polaris Dr
Your Personal Tour Guide
Ask me questions while you tour the home.