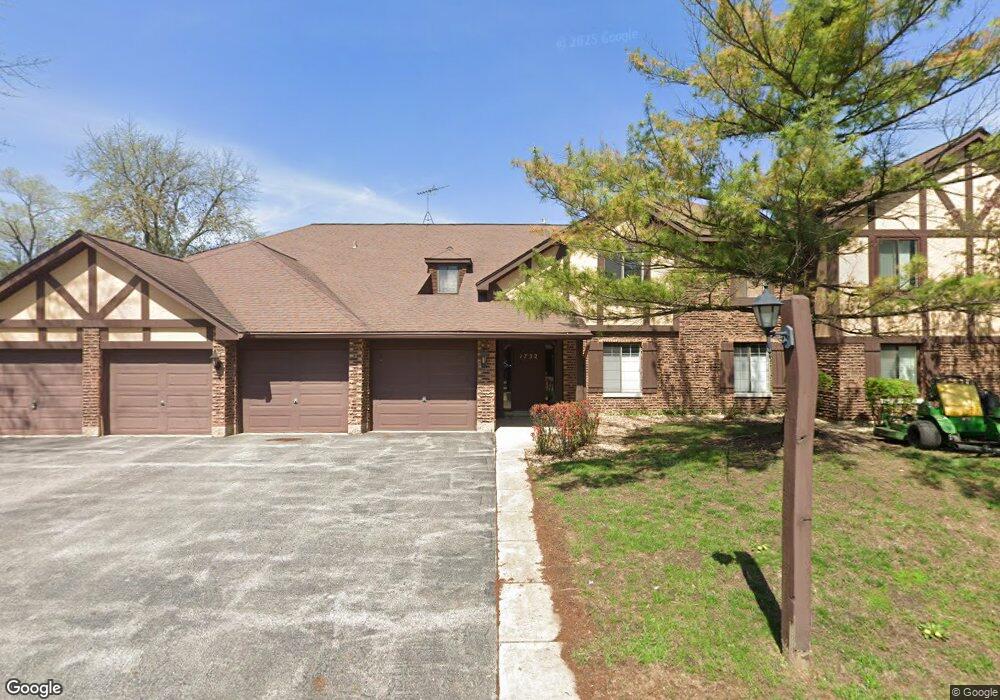
1732 Harrow Ct Unit 1105C Wheaton, IL 60189
North Danada NeighborhoodEstimated Value: $240,079 - $257,000
2
Beds
1
Bath
1,056
Sq Ft
$237/Sq Ft
Est. Value
About This Home
This home is located at 1732 Harrow Ct Unit 1105C, Wheaton, IL 60189 and is currently estimated at $250,770, approximately $237 per square foot. 1732 Harrow Ct Unit 1105C is a home located in DuPage County with nearby schools including Briar Glen Elementary School, Glen Crest Middle School, and Glenbard South High School.
Ownership History
Date
Name
Owned For
Owner Type
Purchase Details
Closed on
Oct 11, 2024
Sold by
Kurek Jerzy
Bought by
Kurek Jerzy Ignacy and Kurek Maria Malgorzata
Current Estimated Value
Purchase Details
Closed on
Mar 14, 2005
Sold by
Schiller Randall and Schiller Patricia
Bought by
Kurek Jerzy
Home Financials for this Owner
Home Financials are based on the most recent Mortgage that was taken out on this home.
Original Mortgage
$121,600
Interest Rate
5.67%
Mortgage Type
Purchase Money Mortgage
Purchase Details
Closed on
Jun 28, 2001
Sold by
Bradford Elsie and Leider Elsie Bradford
Bought by
Schiller Randal and Schiller Patricia
Home Financials for this Owner
Home Financials are based on the most recent Mortgage that was taken out on this home.
Original Mortgage
$92,000
Interest Rate
7.18%
Create a Home Valuation Report for This Property
The Home Valuation Report is an in-depth analysis detailing your home's value as well as a comparison with similar homes in the area
Home Values in the Area
Average Home Value in this Area
Purchase History
| Date | Buyer | Sale Price | Title Company |
|---|---|---|---|
| Kurek Jerzy Ignacy | -- | None Listed On Document | |
| Kurek Jerzy | $152,000 | Git | |
| Schiller Randal | $115,000 | -- |
Source: Public Records
Mortgage History
| Date | Status | Borrower | Loan Amount |
|---|---|---|---|
| Previous Owner | Kurek Jerzy | $121,600 | |
| Previous Owner | Schiller Randal | $92,000 |
Source: Public Records
Tax History Compared to Growth
Tax History
| Year | Tax Paid | Tax Assessment Tax Assessment Total Assessment is a certain percentage of the fair market value that is determined by local assessors to be the total taxable value of land and additions on the property. | Land | Improvement |
|---|---|---|---|---|
| 2024 | $4,442 | $58,806 | $6,203 | $52,603 |
| 2023 | $4,263 | $54,130 | $5,710 | $48,420 |
| 2022 | $3,844 | $48,810 | $5,390 | $43,420 |
| 2021 | $3,364 | $47,650 | $5,260 | $42,390 |
| 2020 | $3,394 | $47,200 | $5,210 | $41,990 |
| 2019 | $3,297 | $45,950 | $5,070 | $40,880 |
| 2018 | $2,986 | $41,750 | $4,780 | $36,970 |
| 2017 | $2,575 | $37,830 | $4,330 | $33,500 |
| 2016 | $2,522 | $36,320 | $4,160 | $32,160 |
| 2015 | $2,486 | $34,650 | $3,970 | $30,680 |
| 2014 | $2,727 | $36,940 | $4,040 | $32,900 |
| 2013 | $2,645 | $37,050 | $4,050 | $33,000 |
Source: Public Records
Map
Nearby Homes
- 1751 Plymouth Ct Unit B
- 23W160 Woodcroft Dr
- 1687 Williamsburg Ct Unit B
- 1010 Heathrow Ct
- 1129 Rhodes Ct
- 1581 Groton Ln
- 215 Orchard Ln
- 1038 Liskeard Ct
- 1244 Loughborough Ct
- 453 Raintree Dr Unit 5A
- 464 Raintree Dr Unit 2D
- 478 Raintree Ct Unit 2B
- 470 Raintree Ct Unit 3L
- 450 Raintree Ct Unit 2B
- 2238 Appleby Dr
- 2231 S Bradford Dr
- 22W364 Glen Park Rd
- 1000 S Lorraine Rd Unit 214
- 3S126 Park Blvd
- 1407 Wilson Ave
- 1760 Plymouth Ct Unit A
- 1661 Dover Ct Unit B
- 1651 Dover Ct Unit C
- 1706 Lakecliffe Dr Unit C
- 1782 Gloucester Ct Unit C
- 1779 Gloucester Ct Unit 3103
- 1827 Briarcliffe Blvd Unit A
- 1709 Lakecliffe Dr Unit A
- 1758 Plymouth Ct Unit B
- 1753 Plymouth Ct Unit C
- 1760 Plymouth Ct Unit B
- 1709 Lakecliffe Dr Unit D
- 1657 Dover Ct Unit B
- 1779 Gloucester Ct Unit B
- 1735 Harrow Ct Unit D
- 1702 Lakecliffe Dr Unit B
- 1827 Briarcliffe Blvd Unit D
- 1779 Gloucester Ct Unit D
- 1706 Lakecliffe Dr Unit B