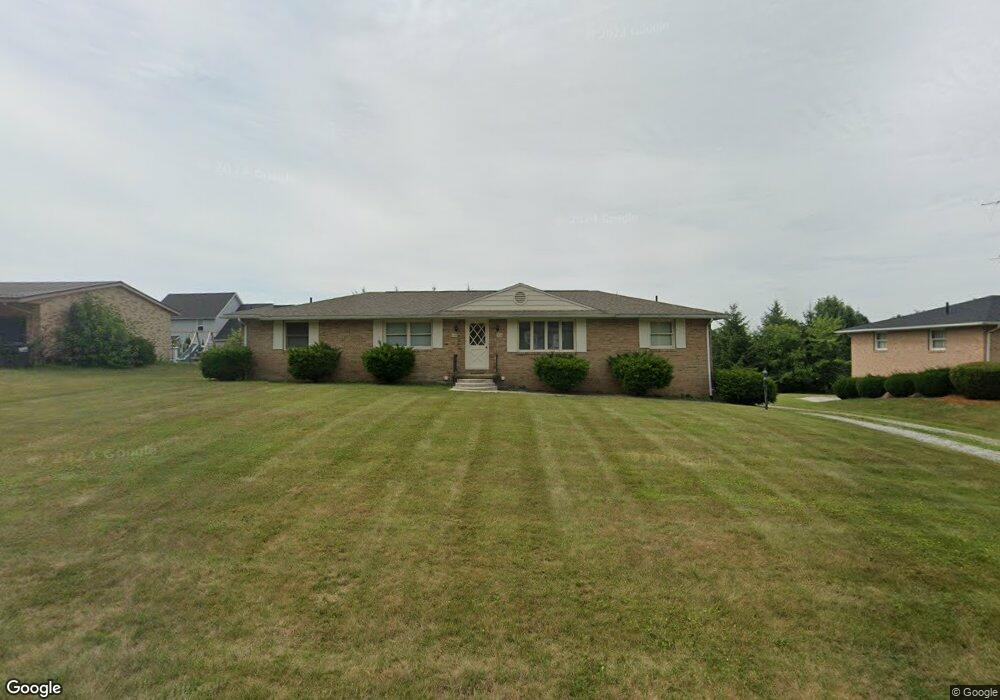
1732 High St Louisville, OH 44641
Estimated Value: $172,587 - $204,000
4
Beds
2
Baths
1,728
Sq Ft
$110/Sq Ft
Est. Value
About This Home
This home is located at 1732 High St, Louisville, OH 44641 and is currently estimated at $189,647, approximately $109 per square foot. 1732 High St is a home located in Stark County with nearby schools including Louisville High School and St. Thomas Aquinas High School & Middle School.
Ownership History
Date
Name
Owned For
Owner Type
Purchase Details
Closed on
Feb 23, 2001
Sold by
Mickley Dean P
Bought by
Mickley Allen D
Current Estimated Value
Home Financials for this Owner
Home Financials are based on the most recent Mortgage that was taken out on this home.
Original Mortgage
$107,250
Interest Rate
7.06%
Mortgage Type
Purchase Money Mortgage
Purchase Details
Closed on
Feb 23, 1998
Sold by
Tomak J T
Bought by
Mickley Allen D and Mickley Dean P
Home Financials for this Owner
Home Financials are based on the most recent Mortgage that was taken out on this home.
Original Mortgage
$106,697
Interest Rate
6.99%
Mortgage Type
FHA
Purchase Details
Closed on
Aug 25, 1992
Create a Home Valuation Report for This Property
The Home Valuation Report is an in-depth analysis detailing your home's value as well as a comparison with similar homes in the area
Home Values in the Area
Average Home Value in this Area
Purchase History
| Date | Buyer | Sale Price | Title Company |
|---|---|---|---|
| Mickley Allen D | -- | -- | |
| Mickley Allen D | $107,000 | -- | |
| -- | $58,400 | -- |
Source: Public Records
Mortgage History
| Date | Status | Borrower | Loan Amount |
|---|---|---|---|
| Closed | Mickley Allen D | $107,250 | |
| Closed | Mickley Allen D | $106,697 |
Source: Public Records
Tax History Compared to Growth
Tax History
| Year | Tax Paid | Tax Assessment Tax Assessment Total Assessment is a certain percentage of the fair market value that is determined by local assessors to be the total taxable value of land and additions on the property. | Land | Improvement |
|---|---|---|---|---|
| 2025 | -- | $45,260 | $15,960 | $29,300 |
| 2024 | -- | $45,260 | $15,960 | $29,300 |
| 2023 | $2,129 | $48,370 | $15,050 | $33,320 |
| 2022 | $1,067 | $48,370 | $15,050 | $33,320 |
| 2021 | $2,141 | $48,370 | $15,050 | $33,320 |
| 2020 | $1,771 | $43,300 | $13,580 | $29,720 |
| 2019 | $1,780 | $42,600 | $13,580 | $29,020 |
| 2018 | $1,744 | $42,600 | $13,580 | $29,020 |
| 2017 | $1,608 | $37,880 | $11,940 | $25,940 |
| 2016 | $1,641 | $37,880 | $11,940 | $25,940 |
| 2015 | $1,645 | $37,880 | $11,940 | $25,940 |
| 2014 | $1,528 | $32,690 | $10,290 | $22,400 |
| 2013 | $767 | $32,690 | $10,290 | $22,400 |
Source: Public Records
Map
Nearby Homes
- 1715 High St
- 1812 E Broad St
- 641 S Nickelplate St
- 2110 Edmar St
- 308 Superior St
- 520 S Silver St
- 2015 E Main St
- 0 Michigan Blvd
- 728 E Broad St
- 908 Sand Lot Cir
- 510 S Bauman Ct
- 204 E Broad St
- 107 E Broad St
- 325 Lincoln Ave
- 3390 Meese Rd NE
- 1170 Winding Ridge Ave
- 910 Crosswyck Cir
- 1702 View Pointe Ave
- 1639 Horizon Dr
- 428 Honeycrisp Dr NE