1732 N Crystal Cove Unit 5 Haslett, MI 48840
Estimated Value: $349,000 - $410,000
2
Beds
2
Baths
1,360
Sq Ft
$277/Sq Ft
Est. Value
About This Home
This home is located at 1732 N Crystal Cove Unit 5, Haslett, MI 48840 and is currently estimated at $376,169, approximately $276 per square foot. 1732 N Crystal Cove Unit 5 is a home located in Ingham County with nearby schools including Haslett High School and St Thomas Aquinas School.
Ownership History
Date
Name
Owned For
Owner Type
Purchase Details
Closed on
Apr 30, 2022
Sold by
Carol A Sharpe Trust
Bought by
Taylor Michelle R
Current Estimated Value
Purchase Details
Closed on
Aug 26, 2021
Sold by
Sharpe Carol A and Sharpe Francis L
Bought by
Sharpe Carol A and Carol A Sharpe Trust
Purchase Details
Closed on
Jan 15, 2021
Sold by
Riemer Real Estate Investments Llc
Bought by
Sharpe Francis L and Sharpe Carol A
Home Financials for this Owner
Home Financials are based on the most recent Mortgage that was taken out on this home.
Original Mortgage
$185,600
Interest Rate
2.71%
Mortgage Type
New Conventional
Purchase Details
Closed on
Jun 19, 2008
Sold by
Andrew Riemer Llc
Bought by
Riemer Real Estate Investments Llc
Purchase Details
Closed on
May 2, 2008
Sold by
Ethel M Lindner Trust
Bought by
Andrew Riemer Llc
Purchase Details
Closed on
Jun 14, 2006
Sold by
Northport Of Meridian Condominiums Llc
Bought by
Ethel M Lindner Trust
Create a Home Valuation Report for This Property
The Home Valuation Report is an in-depth analysis detailing your home's value as well as a comparison with similar homes in the area
Home Values in the Area
Average Home Value in this Area
Purchase History
| Date | Buyer | Sale Price | Title Company |
|---|---|---|---|
| Taylor Michelle R | $285,000 | -- | |
| Sharpe Carol A | -- | None Available | |
| Sharpe Francis L | $232,000 | Liberty Title | |
| Riemer Real Estate Investments Llc | -- | None Available | |
| Andrew Riemer Llc | $170,000 | Tri Title Agency Llc | |
| Ethel M Lindner Trust | $41,900 | None Available |
Source: Public Records
Mortgage History
| Date | Status | Borrower | Loan Amount |
|---|---|---|---|
| Previous Owner | Sharpe Francis L | $185,600 |
Source: Public Records
Tax History Compared to Growth
Tax History
| Year | Tax Paid | Tax Assessment Tax Assessment Total Assessment is a certain percentage of the fair market value that is determined by local assessors to be the total taxable value of land and additions on the property. | Land | Improvement |
|---|---|---|---|---|
| 2025 | $8,389 | $151,400 | $28,500 | $122,900 |
| 2024 | $37 | $154,100 | $28,500 | $125,600 |
| 2023 | $7,880 | $144,400 | $32,500 | $111,900 |
| 2022 | $6,502 | $118,100 | $31,500 | $86,600 |
| 2021 | $5,341 | $111,900 | $30,500 | $81,400 |
| 2020 | $6,981 | $110,400 | $30,500 | $79,900 |
| 2019 | $6,894 | $110,100 | $29,900 | $80,200 |
| 2018 | $6,663 | $110,700 | $31,700 | $79,000 |
| 2017 | $6,235 | $107,800 | $30,700 | $77,100 |
| 2016 | $2,836 | $104,700 | $31,500 | $73,200 |
| 2015 | $2,836 | $99,800 | $50,400 | $49,400 |
| 2014 | $2,836 | $96,900 | $51,200 | $45,700 |
Source: Public Records
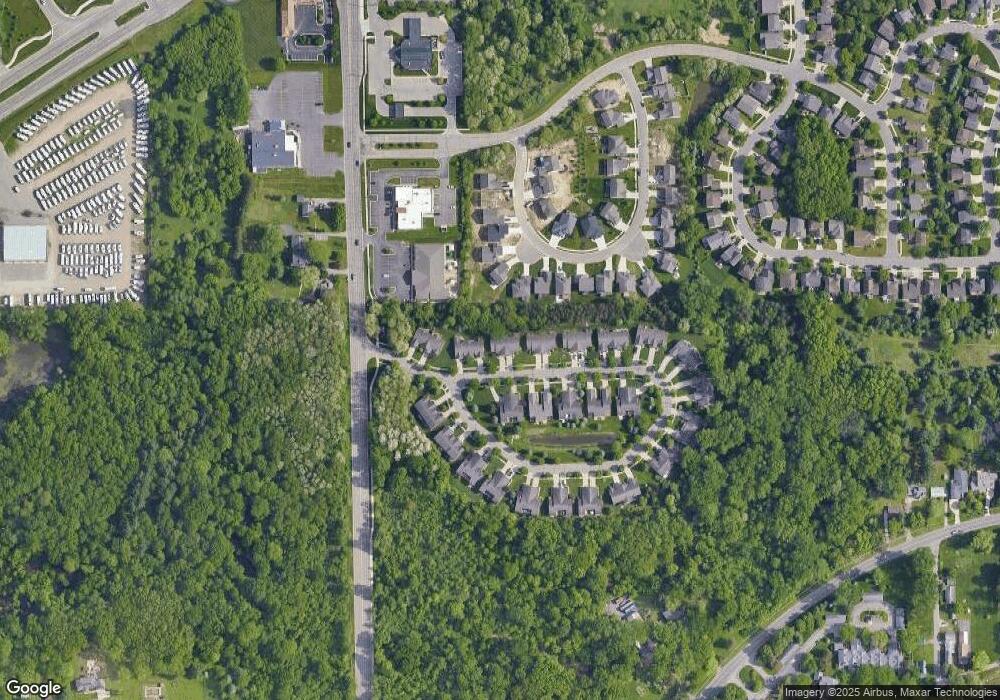
Map
Nearby Homes
- 16925 Willowbrook Dr
- 7822 Forestview Dr
- 6325 W Lake Dr
- 1827 Towner Rd
- 6370 Royal Oak Dr
- 16680 Eunice St
- 6248 W Reynolds Rd
- 6427 W Reynolds Rd
- 6403 E Reynolds Rd
- 0 English Oak Dr
- 16931 Black Walnut Ln
- 5989 Cypress St
- 6708 English Oak Dr
- 16673 Sundew Cir
- Lot A Lake Lansing Rd
- Lot B Lake Lansing Rd
- 6120 Fresno Ln
- 5906 Marsh Rd
- 8566 Old State Highway 78
- 6111 Fresno Ln
- 1732 N Crystal Cove
- 1738 N Crystal Cove Unit 4
- 1730 N Crystal Cove
- 1724 N Crystal Cove Unit 7
- 1740 N Crystal Cove Unit 3
- 1731 N Crystal Cove Unit 39
- 16952 Willowbrook Dr
- 1729 N Crystal Cove Unit 40
- 1722 N Crystal Cove Unit 8
- 16948 Willowbrook Dr
- 1746 N Crystal Cove Unit 2
- 1723 N Crystal Cove Unit RANCH
- 1723 N Crystal Cove
- 1721 N Crystal Cove Unit 42
- 1721 N Crystal Cove
- 1745 N Crystal Cove
- 16956 Willowbrook Dr
- 1716 N Crystal Cove
- 1716 N Crystal Cove Unit 9