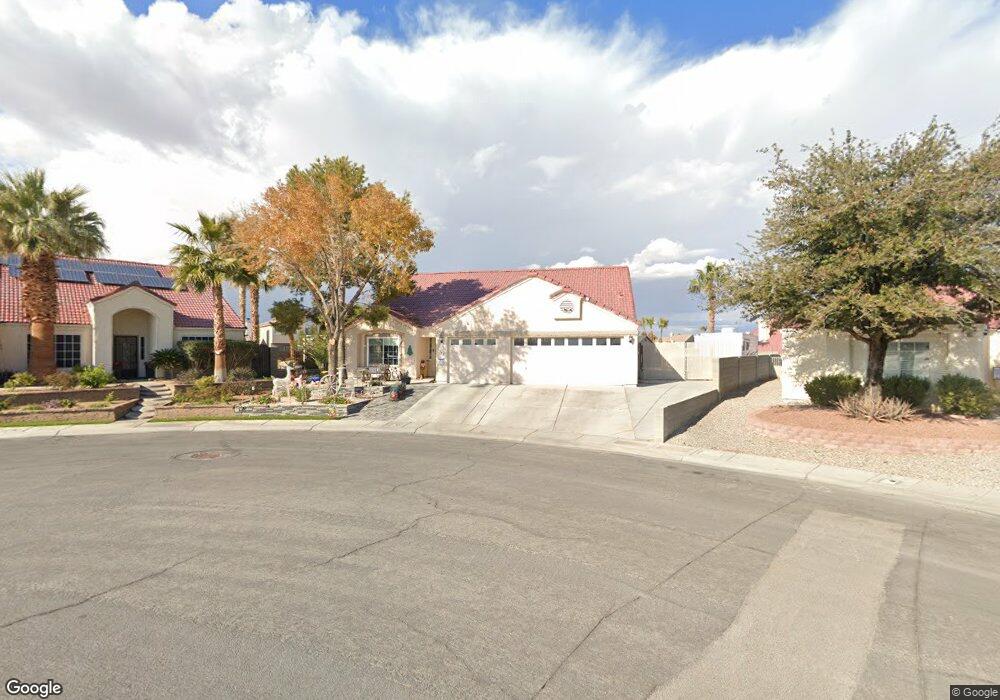
1732 Pinter Way North Las Vegas, NV 89032
Cheyenne NeighborhoodEstimated Value: $435,000 - $447,963
3
Beds
2
Baths
1,999
Sq Ft
$221/Sq Ft
Est. Value
About This Home
This home is located at 1732 Pinter Way, North Las Vegas, NV 89032 and is currently estimated at $441,241, approximately $220 per square foot. 1732 Pinter Way is a home located in Clark County with nearby schools including Richard C. Priest Elementary School, Theron L Swainston Middle School, and Cheyenne High School.
Ownership History
Date
Name
Owned For
Owner Type
Purchase Details
Closed on
Sep 13, 1999
Sold by
Fannie Mae
Bought by
Rivera Randy L and Rivera Josiane S
Current Estimated Value
Home Financials for this Owner
Home Financials are based on the most recent Mortgage that was taken out on this home.
Original Mortgage
$137,655
Outstanding Balance
$41,029
Interest Rate
7.89%
Mortgage Type
Purchase Money Mortgage
Estimated Equity
$400,212
Purchase Details
Closed on
Apr 9, 1999
Sold by
Williams Timothy T and Williams Asia
Bought by
Chase Manhattan Mtg Corp
Purchase Details
Closed on
Feb 18, 1998
Sold by
Miller Williams Asia
Bought by
Williams Timothy T
Purchase Details
Closed on
Dec 23, 1997
Sold by
Chase Manhattan Mtg Corp
Bought by
Federal National Mortgage Association
Purchase Details
Closed on
Feb 6, 1997
Sold by
Black Diamond Bay Partnership
Bought by
Williams Timothy T and Williams Asia
Home Financials for this Owner
Home Financials are based on the most recent Mortgage that was taken out on this home.
Original Mortgage
$134,800
Interest Rate
7.62%
Create a Home Valuation Report for This Property
The Home Valuation Report is an in-depth analysis detailing your home's value as well as a comparison with similar homes in the area
Home Values in the Area
Average Home Value in this Area
Purchase History
| Date | Buyer | Sale Price | Title Company |
|---|---|---|---|
| Rivera Randy L | $145,000 | Lawyers Title | |
| Chase Manhattan Mtg Corp | $137,500 | Land Title | |
| Williams Timothy T | -- | -- | |
| Federal National Mortgage Association | -- | Land Title | |
| Williams Timothy T | $142,000 | First American Title Co |
Source: Public Records
Mortgage History
| Date | Status | Borrower | Loan Amount |
|---|---|---|---|
| Open | Rivera Randy L | $137,655 | |
| Previous Owner | Williams Timothy T | $134,800 |
Source: Public Records
Tax History Compared to Growth
Tax History
| Year | Tax Paid | Tax Assessment Tax Assessment Total Assessment is a certain percentage of the fair market value that is determined by local assessors to be the total taxable value of land and additions on the property. | Land | Improvement |
|---|---|---|---|---|
| 2025 | $1,645 | $105,434 | $33,600 | $71,834 |
| 2024 | $1,598 | $105,434 | $33,600 | $71,834 |
| 2023 | $1,598 | $104,453 | $36,120 | $68,333 |
| 2022 | $1,552 | $92,637 | $30,030 | $62,607 |
| 2021 | $1,506 | $87,963 | $28,210 | $59,753 |
| 2020 | $1,460 | $87,560 | $28,210 | $59,350 |
| 2019 | $1,417 | $81,164 | $22,750 | $58,414 |
| 2018 | $1,376 | $75,408 | $19,110 | $56,298 |
| 2017 | $2,450 | $73,036 | $15,925 | $57,111 |
| 2016 | $1,304 | $58,807 | $11,830 | $46,977 |
| 2015 | $1,300 | $45,900 | $9,100 | $36,800 |
| 2014 | $1,262 | $38,058 | $6,825 | $31,233 |
Source: Public Records
Map
Nearby Homes
- 0 June Unit 2706697
- 0 June Unit 2692591
- 0 Tamerind St Unit 2685915
- 0 0 Cheyenne & Englestad Unit 1536141
- 0 0 Englestad Cheyenne Unit 1635643
- 1822 Trigger Way
- 1854 Oak Bluffs Ave
- 3228 Trinitero St
- 1608 Knoll Heights Ct
- 3355 Clayton St
- 00 Ward
- 0 Clayton Unit 2712913
- 3644 Quail Creek Dr
- 01 Brooks St
- 410 Rocky Peak Dr Unit 1704
- 3317 Spinet Dr
- 3804 Debussy Way
- 1981 Komodo Dragon Ct
- 2124 Cabrini Ct
- 3834 W Gowan Rd
- 3325 Oconnell Way Unit 4
- 1728 Pinter Way
- 1727 Ridosh Cir
- 3321 Oconnell Way
- 1731 Ridosh Cir
- 1724 Pinter Way
- 1723 Ridosh Cir
- 3338 Capitol Reef Dr
- 3342 Capitol Reef Dr
- 3334 Capitol Reef Dr
- 1727 Pinter Way
- 3330 Capitol Reef Dr
- 3346 Capitol Reef Dr
- 3317 Oconnell Way Unit 4
- 1719 Ridosh Cir
- 1720 Pinter Way
- 3326 Capitol Reef Dr
- 3350 Capitol Reef Dr
- 1723 Pinter Way
- 3322 Capitol Reef Dr