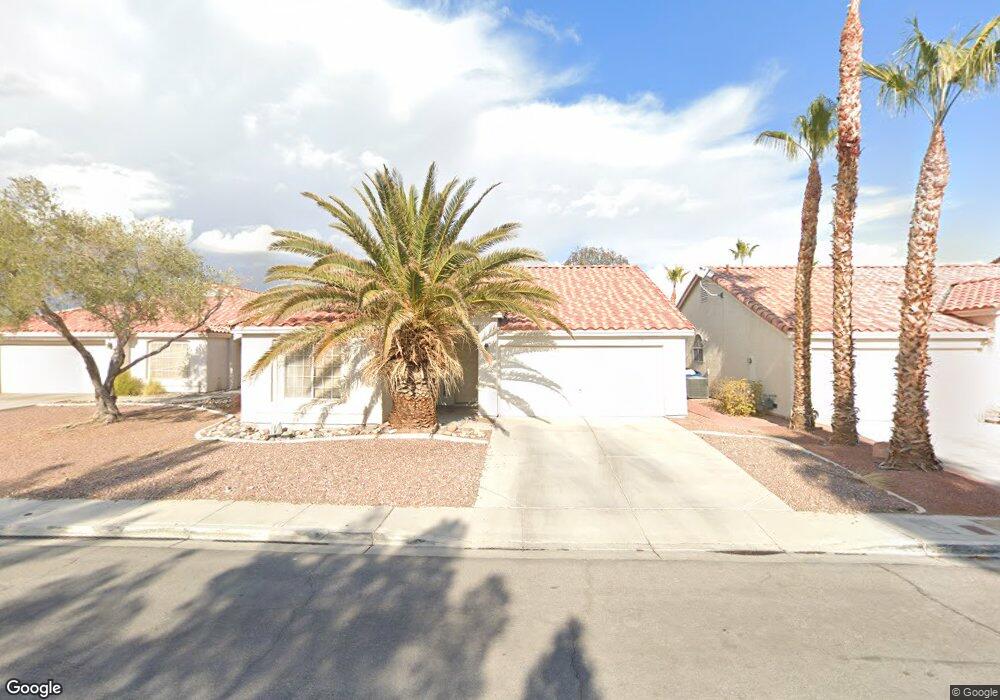
1732 Shadow Bay Ct Unit 2B North Las Vegas, NV 89032
Cheyenne NeighborhoodEstimated Value: $376,616 - $399,000
2
Beds
2
Baths
1,576
Sq Ft
$247/Sq Ft
Est. Value
About This Home
This home is located at 1732 Shadow Bay Ct Unit 2B, North Las Vegas, NV 89032 and is currently estimated at $388,654, approximately $246 per square foot. 1732 Shadow Bay Ct Unit 2B is a home located in Clark County with nearby schools including Richard C. Priest Elementary School, Theron L Swainston Middle School, and Cheyenne High School.
Ownership History
Date
Name
Owned For
Owner Type
Purchase Details
Closed on
Jun 12, 2002
Sold by
Fresquez Julie E and Fresquez Christopher A
Bought by
Wesley Donald R
Current Estimated Value
Home Financials for this Owner
Home Financials are based on the most recent Mortgage that was taken out on this home.
Original Mortgage
$148,900
Outstanding Balance
$62,646
Interest Rate
6.74%
Mortgage Type
VA
Estimated Equity
$326,008
Purchase Details
Closed on
May 20, 2002
Sold by
Wesley Robin V
Bought by
Wesley Donald R
Home Financials for this Owner
Home Financials are based on the most recent Mortgage that was taken out on this home.
Original Mortgage
$148,900
Outstanding Balance
$62,646
Interest Rate
6.74%
Mortgage Type
VA
Estimated Equity
$326,008
Purchase Details
Closed on
Jan 13, 1994
Sold by
Highlands Associates
Bought by
Fresquez Christopher A and Fresquez Julie E
Home Financials for this Owner
Home Financials are based on the most recent Mortgage that was taken out on this home.
Original Mortgage
$115,514
Interest Rate
5.5%
Mortgage Type
FHA
Create a Home Valuation Report for This Property
The Home Valuation Report is an in-depth analysis detailing your home's value as well as a comparison with similar homes in the area
Home Values in the Area
Average Home Value in this Area
Purchase History
| Date | Buyer | Sale Price | Title Company |
|---|---|---|---|
| Wesley Donald R | $146,000 | Nevada Title Company | |
| Wesley Donald R | $146,000 | Nevada Title Company | |
| Fresquez Christopher A | $116,500 | Stewart Title |
Source: Public Records
Mortgage History
| Date | Status | Borrower | Loan Amount |
|---|---|---|---|
| Open | Wesley Donald R | $148,900 | |
| Previous Owner | Fresquez Christopher A | $115,514 |
Source: Public Records
Tax History Compared to Growth
Tax History
| Year | Tax Paid | Tax Assessment Tax Assessment Total Assessment is a certain percentage of the fair market value that is determined by local assessors to be the total taxable value of land and additions on the property. | Land | Improvement |
|---|---|---|---|---|
| 2025 | $1,388 | $80,982 | $28,000 | $52,982 |
| 2024 | $1,348 | $80,982 | $28,000 | $52,982 |
| 2023 | $1,348 | $79,361 | $28,700 | $50,661 |
| 2022 | $1,435 | $69,543 | $23,100 | $46,443 |
| 2021 | $1,329 | $64,966 | $20,650 | $44,316 |
| 2020 | $1,231 | $64,085 | $19,950 | $44,135 |
| 2019 | $1,154 | $61,111 | $17,500 | $43,611 |
| 2018 | $1,101 | $57,496 | $15,400 | $42,096 |
| 2017 | $1,857 | $55,357 | $12,600 | $42,757 |
| 2016 | $1,031 | $48,850 | $8,400 | $40,450 |
| 2015 | $1,028 | $37,663 | $7,000 | $30,663 |
| 2014 | $998 | $28,876 | $5,250 | $23,626 |
Source: Public Records
Map
Nearby Homes
- 1718 Woodward Heights Way
- 3644 Quail Creek Dr
- 3700 Covewick Dr
- 1608 Knoll Heights Ct
- 3804 Debussy Way
- 1822 Trigger Way
- 3839 Dusty Glen Ct
- 0 June Unit 2706697
- 0 June Unit 2692591
- 0 Tamerind St Unit 2685915
- 0 0 Cheyenne & Englestad Unit 1536141
- 0 0 Englestad Cheyenne Unit 1635643
- 3841 Intermezzo Way
- 1854 Oak Bluffs Ave
- 1881 W Alexander Rd Unit 1092
- 1881 W Alexander Rd Unit 1100
- 1881 W Alexander Rd Unit 2079
- 410 Rocky Peak Dr Unit 1704
- 3825 Iverson Ln
- 2124 Cabrini Ct
- 1728 Shadow Bay Ct
- 1736 Shadow Bay Ct
- 1724 Shadow Bay Ct
- 1731 Ashburn Dr
- 1735 Ashburn Dr
- 1727 Ashburn Dr
- 1720 Shadow Bay Ct
- 1739 Ashburn Dr
- 1723 Ashburn Dr Unit 2B
- 1740 Shadow Bay Ct
- 1731 Shadow Bay Ct
- 1727 Shadow Bay Ct Unit 2B
- 1735 Shadow Bay Ct
- 1719 Ashburn Dr
- 1743 Ashburn Dr
- 1716 Shadow Bay Ct
- 1723 Shadow Bay Ct
- 1743 Shadow Bay Ct
- 1739 Shadow Bay Ct
- 1719 Shadow Bay Ct