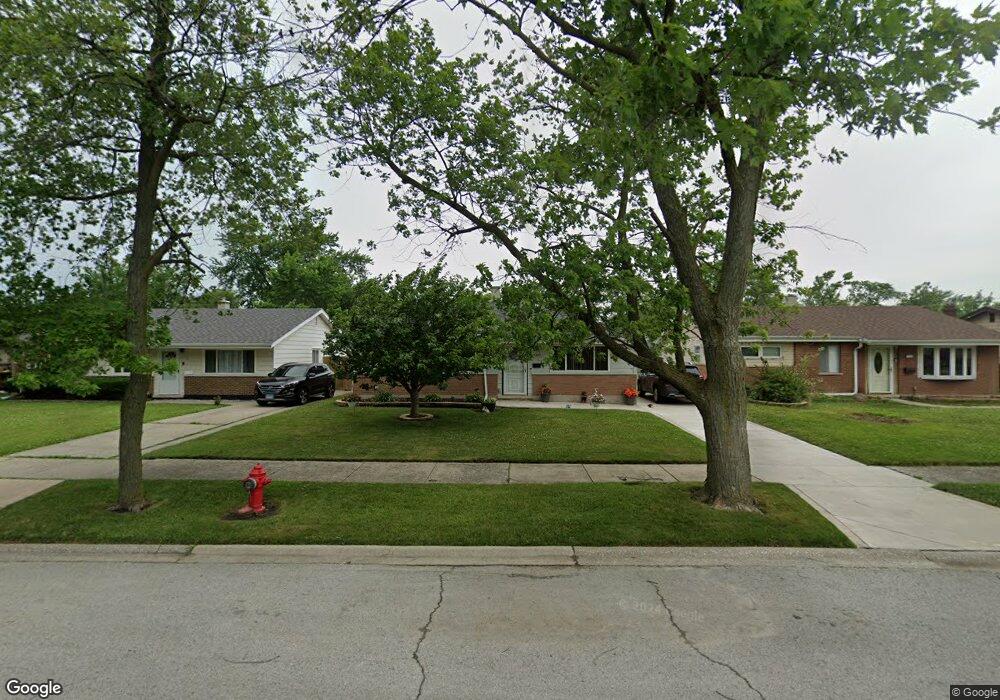
17322 Henry St Lansing, IL 60438
Estimated Value: $157,000 - $187,000
3
Beds
1
Bath
1,147
Sq Ft
$149/Sq Ft
Est. Value
About This Home
This home is located at 17322 Henry St, Lansing, IL 60438 and is currently estimated at $171,305, approximately $149 per square foot. 17322 Henry St is a home located in Cook County with nearby schools including Reavis Elementary School, Memorial Jr High School, and Thornton Fractnl So High School.
Ownership History
Date
Name
Owned For
Owner Type
Purchase Details
Closed on
Jun 26, 2001
Sold by
Grafenauer John
Bought by
Grafenauer John and Grafenauer Julie
Current Estimated Value
Purchase Details
Closed on
Feb 25, 2000
Sold by
Durnbaugh John
Bought by
Grafenauer John
Home Financials for this Owner
Home Financials are based on the most recent Mortgage that was taken out on this home.
Original Mortgage
$81,748
Interest Rate
8.3%
Mortgage Type
FHA
Purchase Details
Closed on
Nov 12, 1999
Sold by
Smith Dawn M
Bought by
Watkins Geoffrey R and Watkins Mary K
Purchase Details
Closed on
Oct 31, 1995
Sold by
Leech Lisa M Kolk
Bought by
Durnbaugh John
Home Financials for this Owner
Home Financials are based on the most recent Mortgage that was taken out on this home.
Original Mortgage
$54,250
Interest Rate
7.65%
Create a Home Valuation Report for This Property
The Home Valuation Report is an in-depth analysis detailing your home's value as well as a comparison with similar homes in the area
Home Values in the Area
Average Home Value in this Area
Purchase History
| Date | Buyer | Sale Price | Title Company |
|---|---|---|---|
| Grafenauer John | -- | Law Title | |
| Grafenauer John | $82,000 | -- | |
| Watkins Geoffrey R | -- | -- | |
| Durnbaugh John | $77,500 | Intercounty Title |
Source: Public Records
Mortgage History
| Date | Status | Borrower | Loan Amount |
|---|---|---|---|
| Previous Owner | Grafenauer John | $81,748 | |
| Previous Owner | Durnbaugh John | $54,250 |
Source: Public Records
Tax History
| Year | Tax Paid | Tax Assessment Tax Assessment Total Assessment is a certain percentage of the fair market value that is determined by local assessors to be the total taxable value of land and additions on the property. | Land | Improvement |
|---|---|---|---|---|
| 2025 | $3,718 | $11,000 | $2,480 | $8,520 |
| 2024 | $3,718 | $11,000 | $2,480 | $8,520 |
| 2023 | $2,829 | $11,000 | $2,480 | $8,520 |
| 2022 | $2,829 | $7,773 | $2,170 | $5,603 |
| 2021 | $2,808 | $7,773 | $2,170 | $5,603 |
| 2020 | $2,740 | $7,773 | $2,170 | $5,603 |
| 2019 | $2,774 | $8,301 | $2,015 | $6,286 |
| 2018 | $2,719 | $8,301 | $2,015 | $6,286 |
| 2017 | $2,779 | $8,301 | $2,015 | $6,286 |
| 2016 | $3,233 | $8,409 | $1,860 | $6,549 |
| 2015 | $2,939 | $8,409 | $1,860 | $6,549 |
| 2014 | $2,926 | $8,409 | $1,860 | $6,549 |
| 2013 | $2,993 | $9,277 | $1,860 | $7,417 |
Source: Public Records
Map
Nearby Homes
- 17335 Community St
- 17303 Roy St
- 17423 Walter St
- 17226 Community St
- 17318 Walter St
- 17519 Community St
- 17518 Roy St
- 17552 Roy St
- 17153 Walter St
- 17204 Bernadine St
- 17244 Wentworth Ave
- 17132 Walter St
- 17617 Burnham Ave
- 3351 171st St
- 3018 Bernice Rd Unit 205
- 17056 Burnham Ave
- 3636 172nd St
- 17702 Bernadine St
- 17303 Chicago Ave
- 3425 Bernice Ave
- 17326 Henry St
- 17318 Henry St
- 17330 Henry St
- 17314 Henry St
- 17323 Community St
- 17327 Community St
- 17334 Henry St
- 17319 Community St
- 17310 Henry St
- 17319 Henry St
- 17331 Community St
- 17315 Community St
- 17306 Henry St
- 17306 Henry St
- 17335 Community St Unit y St
- 17311 Community St
- 17307 Community St
- 3402 173rd Place
- 17302 Henry St
- 3358 Bernice Rd
Your Personal Tour Guide
Ask me questions while you tour the home.