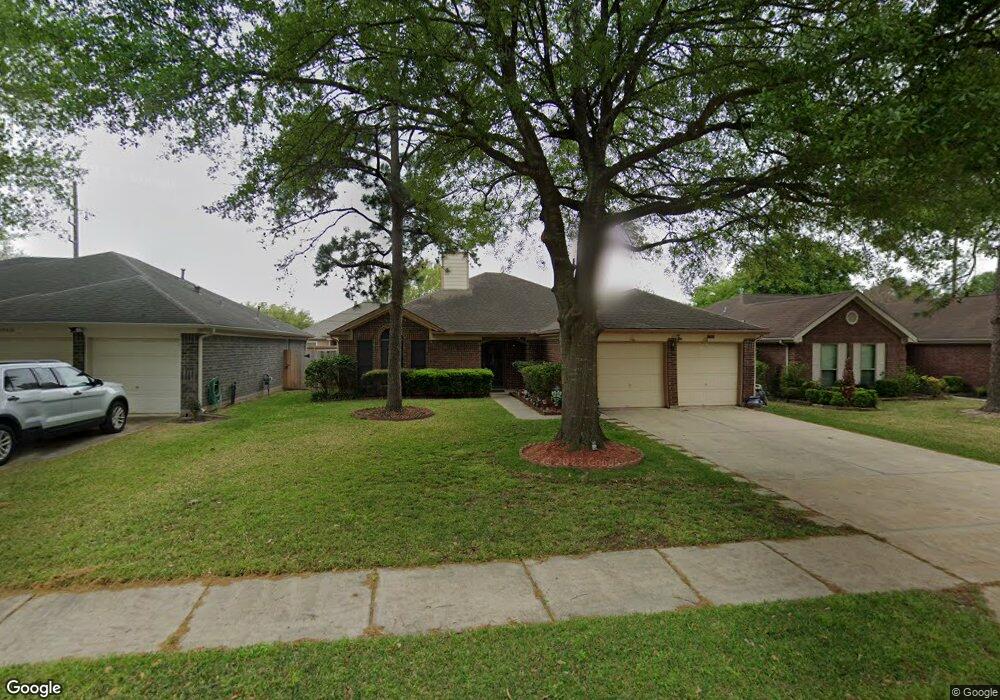
17323 Hamilwood Dr Houston, TX 77095
Copperfield NeighborhoodEstimated Value: $269,719 - $300,000
3
Beds
2
Baths
1,922
Sq Ft
$150/Sq Ft
Est. Value
About This Home
This home is located at 17323 Hamilwood Dr, Houston, TX 77095 and is currently estimated at $288,680, approximately $150 per square foot. 17323 Hamilwood Dr is a home located in Harris County with nearby schools including Holmsley Elementary School, Aragon Middle School, and Langham Creek High School.
Ownership History
Date
Name
Owned For
Owner Type
Purchase Details
Closed on
Jul 7, 2010
Sold by
Federal Home Loan Mortgage Corporation
Bought by
Torres Maria Evelyn
Current Estimated Value
Purchase Details
Closed on
Apr 6, 2010
Sold by
Parker Anthony P and Parker Brenda Louise
Bought by
Federal Home Loan Mortgage Corp
Purchase Details
Closed on
Dec 20, 2002
Sold by
Canciller Ernesto B and Canciller Celerina R
Bought by
Parker Anthony P and Parker Brenda Louise
Home Financials for this Owner
Home Financials are based on the most recent Mortgage that was taken out on this home.
Original Mortgage
$109,250
Interest Rate
6.05%
Purchase Details
Closed on
Jan 9, 1996
Sold by
Kim Eugene H and Kim Eunmi
Bought by
Canciller Ernesto B and Canciller Celerina R
Home Financials for this Owner
Home Financials are based on the most recent Mortgage that was taken out on this home.
Original Mortgage
$40,000
Interest Rate
7.14%
Create a Home Valuation Report for This Property
The Home Valuation Report is an in-depth analysis detailing your home's value as well as a comparison with similar homes in the area
Home Values in the Area
Average Home Value in this Area
Purchase History
| Date | Buyer | Sale Price | Title Company |
|---|---|---|---|
| Torres Maria Evelyn | -- | Texas American Title Company | |
| Federal Home Loan Mortgage Corp | $107,708 | None Available | |
| Parker Anthony P | -- | Startex Title Company | |
| Canciller Ernesto B | -- | Commonwealth Land Title Co |
Source: Public Records
Mortgage History
| Date | Status | Borrower | Loan Amount |
|---|---|---|---|
| Previous Owner | Parker Anthony P | $109,250 | |
| Previous Owner | Canciller Ernesto B | $40,000 |
Source: Public Records
Tax History Compared to Growth
Tax History
| Year | Tax Paid | Tax Assessment Tax Assessment Total Assessment is a certain percentage of the fair market value that is determined by local assessors to be the total taxable value of land and additions on the property. | Land | Improvement |
|---|---|---|---|---|
| 2025 | $3,806 | $273,863 | $60,490 | $213,373 |
| 2024 | $3,806 | $263,034 | $52,613 | $210,421 |
| 2023 | $3,806 | $277,922 | $52,613 | $225,309 |
| 2022 | $5,146 | $246,363 | $37,491 | $208,872 |
| 2021 | $4,909 | $198,658 | $37,491 | $161,167 |
| 2020 | $4,666 | $182,323 | $31,190 | $151,133 |
| 2019 | $4,628 | $176,586 | $26,464 | $150,122 |
| 2018 | $1,533 | $164,317 | $26,464 | $137,853 |
| 2017 | $4,250 | $164,317 | $26,464 | $137,853 |
| 2016 | $3,993 | $154,383 | $26,464 | $127,919 |
| 2015 | $2,473 | $144,737 | $22,054 | $122,683 |
| 2014 | $2,473 | $141,269 | $22,054 | $119,215 |
Source: Public Records
Map
Nearby Homes
- 17326 Masonridge Dr
- 17222 Crown Meadow Ct
- 17230 Valhallah Way
- 17206 Haley Falls Ln
- 16902 Terrace Park Dr
- 17523 Hamilwood Dr
- 17114 Sheffield Pines Ln
- 17527 Hamilwood Dr
- 17531 Hamilwood Dr
- 17522 Masonridge Dr
- 17214 Palm Falls Ct
- 7626 Almond Springs Dr
- 7539 Wildwood Brook Ct
- 7807 Hickory Mill Ct
- 17234 Rush Trace Ct
- 7306 Bubbling Brooks Ln
- 7311 Barton Oaks Dr
- 17010 Poplar Hill St
- 17814 Stoney Glade Ct
- 16911 Shady Square Ct
- 17319 Hamilwood Dr
- 17327 Hamilwood Dr
- 7422 Sheffield Bend Ct
- 17315 Hamilwood Dr
- 17403 Hamilwood Dr
- 7414 Sheffield Bend Ct
- 17322 Hamilwood Dr
- 17318 Hamilwood Dr
- 17326 Hamilwood Dr
- 17407 Hamilwood Dr
- 7410 Sheffield Bend Ct
- 17311 Hamilwood Dr
- 7426 Sheffield Bend Ct
- 17314 Hamilwood Dr
- 17402 Hamilwood Dr
- 7406 Sheffield Bend Ct
- 17402 Chamberlain Dr
- 17411 Hamilwood Dr
- 17406 Hamilwood Dr
- 17307 Hamilwood Dr