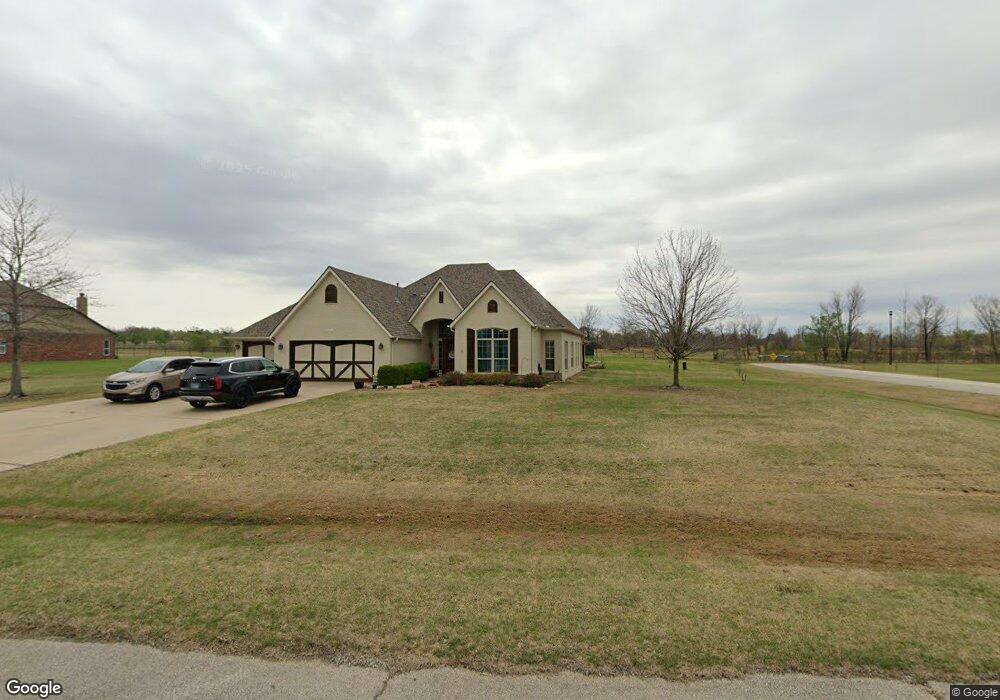
17324 W 60th St S Sand Springs, OK 74063
Estimated Value: $482,808 - $537,000
--
Bed
3
Baths
3,437
Sq Ft
$147/Sq Ft
Est. Value
About This Home
This home is located at 17324 W 60th St S, Sand Springs, OK 74063 and is currently estimated at $506,702, approximately $147 per square foot. 17324 W 60th St S is a home located in Tulsa County with nearby schools including Angus Valley Elementary School, Clyde Boyd Middle School, and Charles Page High School.
Ownership History
Date
Name
Owned For
Owner Type
Purchase Details
Closed on
Jul 18, 2019
Sold by
Lambdin Paul K and Lambdin Melanie A
Bought by
Nobles Michael Eugene and Nobles Michelle Ann
Current Estimated Value
Home Financials for this Owner
Home Financials are based on the most recent Mortgage that was taken out on this home.
Original Mortgage
$275,000
Outstanding Balance
$240,925
Interest Rate
3.82%
Mortgage Type
New Conventional
Estimated Equity
$265,777
Purchase Details
Closed on
Dec 21, 2006
Sold by
American Heritage Bank
Bought by
Lambdin Paul K and Lambdin Melanie A
Home Financials for this Owner
Home Financials are based on the most recent Mortgage that was taken out on this home.
Original Mortgage
$187,000
Interest Rate
6.27%
Mortgage Type
Unknown
Purchase Details
Closed on
Mar 31, 2004
Sold by
Regency Management Corp
Bought by
Cypert Construction Co
Create a Home Valuation Report for This Property
The Home Valuation Report is an in-depth analysis detailing your home's value as well as a comparison with similar homes in the area
Home Values in the Area
Average Home Value in this Area
Purchase History
| Date | Buyer | Sale Price | Title Company |
|---|---|---|---|
| Nobles Michael Eugene | $325,000 | Apex Ttl & Closing Svcs Llc | |
| Lambdin Paul K | $187,000 | None Available | |
| Cypert Construction Co | $33,500 | The Executives Title & Escro |
Source: Public Records
Mortgage History
| Date | Status | Borrower | Loan Amount |
|---|---|---|---|
| Open | Nobles Michael Eugene | $275,000 | |
| Previous Owner | Lambdin Paul K | $187,000 |
Source: Public Records
Tax History Compared to Growth
Tax History
| Year | Tax Paid | Tax Assessment Tax Assessment Total Assessment is a certain percentage of the fair market value that is determined by local assessors to be the total taxable value of land and additions on the property. | Land | Improvement |
|---|---|---|---|---|
| 2024 | $3,964 | $34,750 | $3,761 | $30,989 |
| 2023 | $3,964 | $35,750 | $3,869 | $31,881 |
| 2022 | $3,887 | $34,750 | $3,761 | $30,989 |
| 2021 | $3,949 | $34,750 | $3,761 | $30,989 |
| 2020 | $4,007 | $34,750 | $3,761 | $30,989 |
| 2019 | $2,768 | $23,812 | $2,907 | $20,905 |
| 2018 | $2,621 | $22,678 | $2,768 | $19,910 |
| 2017 | $2,473 | $21,598 | $3,869 | $17,729 |
| 2016 | $2,468 | $21,598 | $3,869 | $17,729 |
| 2015 | $2,485 | $21,598 | $3,869 | $17,729 |
| 2014 | $2,373 | $20,570 | $3,685 | $16,885 |
Source: Public Records
Map
Nearby Homes
- 16902 W 59th St S
- 0 S 167th West Ave
- 1 S 165th West Ave
- 5908 S 157th West Ave
- 001 W 51st St
- 6202 S 155th West Ave
- 6006 S 155th West Ave
- 0 W 57th St S
- 4234 S 261s Ave
- 4061 S 177th W
- 19001 W 41st St
- 16930 W 84th St S
- 003 S 143rd West Ave
- 4220 S 143rd West Ave
- 005 S 143rd West Ave
- 4226 S 143rd West Ave
- 4232 S 143rd West Ave
- 4224 S 143rd West Ave
- 21338 W 81st St S
- 4219 S 143rd West Ave
- 17374 W 60th St S
- 17326 W 60th St S
- 6014 S 174th West Ave
- 17424 W 60th St
- 0 W 60th St
- 0 W 60th St
- 17331 W 60th St S
- 5964 S 174th West Ave
- 17472 W 60th St S
- 17020 W 60th St S
- 5939 S 174th West Ave
- 17025 W 60th St S
- 5920 S 174th West Ave
- 17528 W 60th St S
- 17533 W 60th St S
- 5915 S 174th West Ave
- 17250 W 59th St S
- 17016 W 60th St S
- 17019 W 60th St S
- 5886 S 174th West Ave