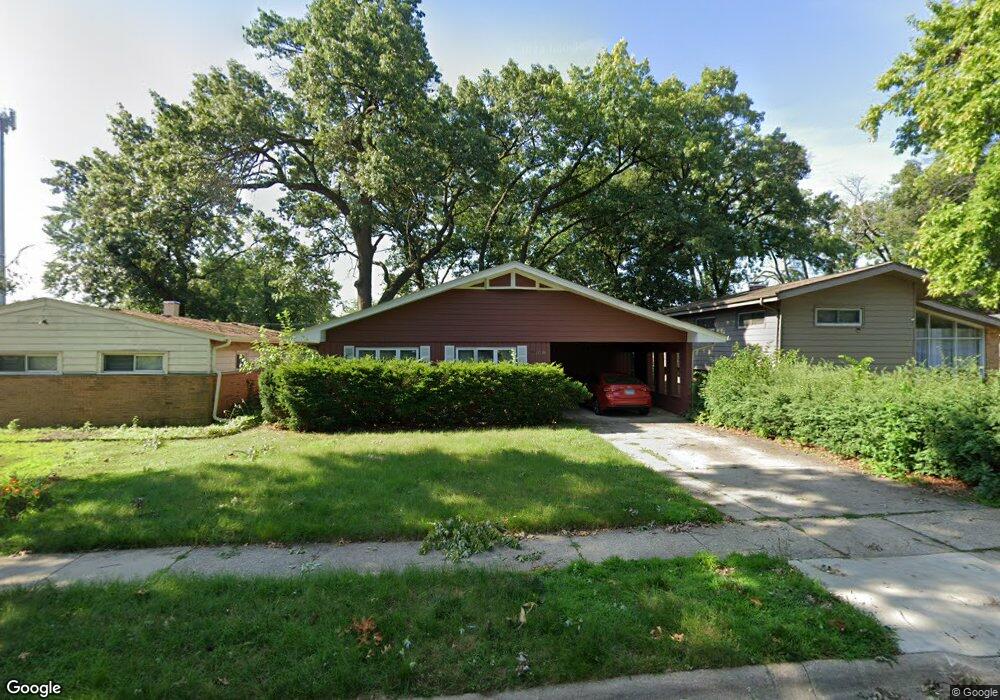
17326 Forestway Dr Hazel Crest, IL 60429
Estimated Value: $118,000 - $167,469
3
Beds
1
Bath
1,258
Sq Ft
$112/Sq Ft
Est. Value
About This Home
This home is located at 17326 Forestway Dr, Hazel Crest, IL 60429 and is currently estimated at $140,367, approximately $111 per square foot. 17326 Forestway Dr is a home located in Cook County with nearby schools including Thornwood High School.
Ownership History
Date
Name
Owned For
Owner Type
Purchase Details
Closed on
Jan 3, 2023
Sold by
Agnew Sheila and Agnew Bennie
Bought by
Honeybee Investments Llc
Current Estimated Value
Home Financials for this Owner
Home Financials are based on the most recent Mortgage that was taken out on this home.
Original Mortgage
$98,000
Interest Rate
6.49%
Mortgage Type
New Conventional
Create a Home Valuation Report for This Property
The Home Valuation Report is an in-depth analysis detailing your home's value as well as a comparison with similar homes in the area
Home Values in the Area
Average Home Value in this Area
Purchase History
| Date | Buyer | Sale Price | Title Company |
|---|---|---|---|
| Honeybee Investments Llc | $100,000 | Fidelity National Title |
Source: Public Records
Mortgage History
| Date | Status | Borrower | Loan Amount |
|---|---|---|---|
| Closed | Honeybee Investments Llc | $98,000 |
Source: Public Records
Tax History Compared to Growth
Tax History
| Year | Tax Paid | Tax Assessment Tax Assessment Total Assessment is a certain percentage of the fair market value that is determined by local assessors to be the total taxable value of land and additions on the property. | Land | Improvement |
|---|---|---|---|---|
| 2024 | $3,474 | $10,000 | $2,500 | $7,500 |
| 2023 | $703 | $10,000 | $2,500 | $7,500 |
| 2022 | $703 | $4,502 | $2,188 | $2,314 |
| 2021 | $747 | $4,500 | $2,187 | $2,313 |
| 2020 | $856 | $4,500 | $2,187 | $2,313 |
| 2019 | $1,206 | $5,446 | $2,031 | $3,415 |
| 2018 | $1,189 | $5,446 | $2,031 | $3,415 |
| 2017 | $1,231 | $5,446 | $2,031 | $3,415 |
| 2016 | $1,767 | $5,646 | $1,875 | $3,771 |
| 2015 | $1,640 | $5,646 | $1,875 | $3,771 |
| 2014 | $1,638 | $5,646 | $1,875 | $3,771 |
| 2013 | $1,783 | $6,260 | $1,875 | $4,385 |
Source: Public Records
Map
Nearby Homes
- 17222 Country Ln
- 17212 Hawthorne Dr
- 17308 Forestway Dr
- 1848 172nd St
- 1903 171st St
- 1921 171st St
- 17046 Winchester Ave
- 17064 Shea Ave
- 1913 170th St
- 17026 Bulger Ave
- 1514 173rd St
- 2030 170th St
- 16930 Winchester Ave
- 16910 Lincoln St
- 16929 Wood St
- 2109 Magnolia Rd
- 2131 170th St
- 16919 Wood St
- 16918 Shea Ave
- 17231 Laflin Ave
- 17328 Forestway Dr
- 17324 Forestway Dr
- 17330 Forestway Dr
- 17322 Forestway Dr
- 17320 Forestway Dr
- 17319 Forestway Dr
- 17319 Forestway Dr
- 17317 Forestway Dr
- 17315 Forestway Dr
- 17313 Forestway Dr
- 17318 Forestway Dr
- 17311 Forestway Dr
- 17311 Hawthorne Dr
- 17316 Forestway Dr
- 17309 Forestway Dr
- 17309 Hawthorne Dr
- 17304 Hawthorne Dr
- 17224 Country Ln
- 17307 Forestway Dr
- 17314 Forestway Dr