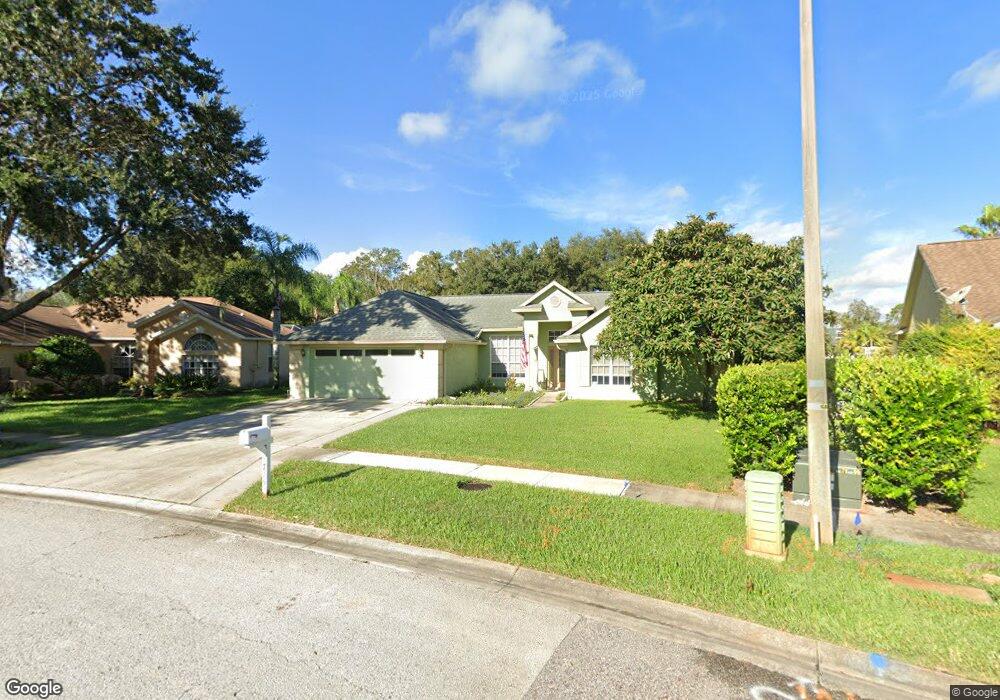
17326 Hubers Ct Odessa, FL 33556
Estimated Value: $702,000 - $769,000
4
Beds
3
Baths
2,582
Sq Ft
$282/Sq Ft
Est. Value
About This Home
This home is located at 17326 Hubers Ct, Odessa, FL 33556 and is currently estimated at $728,758, approximately $282 per square foot. 17326 Hubers Ct is a home located in Hillsborough County with nearby schools including Hammond Elementary School, Martinez Middle School, and Steinbrenner High School.
Ownership History
Date
Name
Owned For
Owner Type
Purchase Details
Closed on
May 23, 2017
Sold by
Bell David W and Bell Tara J
Bought by
Eppler Thomas and Eppler Catherlne
Current Estimated Value
Purchase Details
Closed on
Dec 27, 2012
Sold by
Eppler Catherine G and Eppler Thomas E
Bought by
Eppler Thomas E and Eppler Catherine G
Purchase Details
Closed on
Jul 8, 1998
Sold by
Schafers Jurgen and Lane-Schafers Kortney Lane-Schafers
Bought by
Eppler Catherine G
Home Financials for this Owner
Home Financials are based on the most recent Mortgage that was taken out on this home.
Original Mortgage
$140,400
Interest Rate
7.04%
Mortgage Type
Purchase Money Mortgage
Purchase Details
Closed on
Jun 16, 1994
Sold by
Inland Homes Inc
Bought by
Schafers Jurgen and Schafers Amy A
Home Financials for this Owner
Home Financials are based on the most recent Mortgage that was taken out on this home.
Original Mortgage
$141,950
Interest Rate
8.52%
Mortgage Type
Purchase Money Mortgage
Create a Home Valuation Report for This Property
The Home Valuation Report is an in-depth analysis detailing your home's value as well as a comparison with similar homes in the area
Home Values in the Area
Average Home Value in this Area
Purchase History
| Date | Buyer | Sale Price | Title Company |
|---|---|---|---|
| Eppler Thomas | $62,500 | Riverview Title & Escrow Ser | |
| Eppler Thomas E | -- | Atgf | |
| Eppler Catherine G | $156,000 | -- | |
| Schafers Jurgen | $167,000 | -- |
Source: Public Records
Mortgage History
| Date | Status | Borrower | Loan Amount |
|---|---|---|---|
| Previous Owner | Eppler Catherine G | $166,000 | |
| Previous Owner | Eppler Catherine G | $140,400 | |
| Previous Owner | Schafers Jurgen | $141,950 |
Source: Public Records
Tax History Compared to Growth
Tax History
| Year | Tax Paid | Tax Assessment Tax Assessment Total Assessment is a certain percentage of the fair market value that is determined by local assessors to be the total taxable value of land and additions on the property. | Land | Improvement |
|---|---|---|---|---|
| 2024 | $4,082 | $235,747 | -- | -- |
| 2023 | $3,933 | $228,881 | $0 | $0 |
| 2022 | $3,707 | $222,215 | $0 | $0 |
| 2021 | $3,893 | $215,743 | $0 | $0 |
| 2020 | $3,802 | $212,764 | $0 | $0 |
| 2019 | $3,693 | $207,980 | $0 | $0 |
| 2018 | $3,597 | $204,102 | $0 | $0 |
| 2017 | $3,550 | $278,648 | $0 | $0 |
| 2016 | $3,510 | $195,792 | $0 | $0 |
| 2015 | $3,546 | $194,431 | $0 | $0 |
| 2014 | $3,519 | $192,888 | $0 | $0 |
| 2013 | -- | $190,037 | $0 | $0 |
Source: Public Records
Map
Nearby Homes
- 12514 Wild Berry Trail
- 17311 Gunn Hwy
- 8410 Kenavis Place
- 8503 Kentucky Derby Dr
- 17102 Lake James Rd
- 8510 Lays Cove Place
- 17127 Brown Rd
- 12913 Gunn Hwy
- 7709 Kenia Meadows Ln
- 8903 Donna Lu Dr
- 9116 Roberts Rd
- 16916 Filly Ln
- 18009 Lindawoods St
- 8922 Donna Lu Dr
- 8945 Roberts Rd
- 17302 Stetson Ln
- 17032 Winners Cir
- 17924 Simms Rd
- 17014 Winners Cir
- 9214 Rhea Dr
- 17328 Hubers Ct
- 17324 Hubers Ct
- 17322 Hubers Ct
- 17330 Hubers Ct
- 17325 Hubers Ct
- 17502 Isbell Ln
- 17315 Hubers Ct
- 17401 Gunn Hwy
- 17438 Isbell Ln
- 17318 Hubers Ct
- 17313 Hubers Ct
- 17506 Isbell Ln
- 17436 Isbell Ln
- 17316 Hubers Ct
- 17434 Isbell Ln
- 17501 Isbell Ln
- 17503 Isbell Ln
- 17505 Isbell Ln
- 17439 Isbell Ln