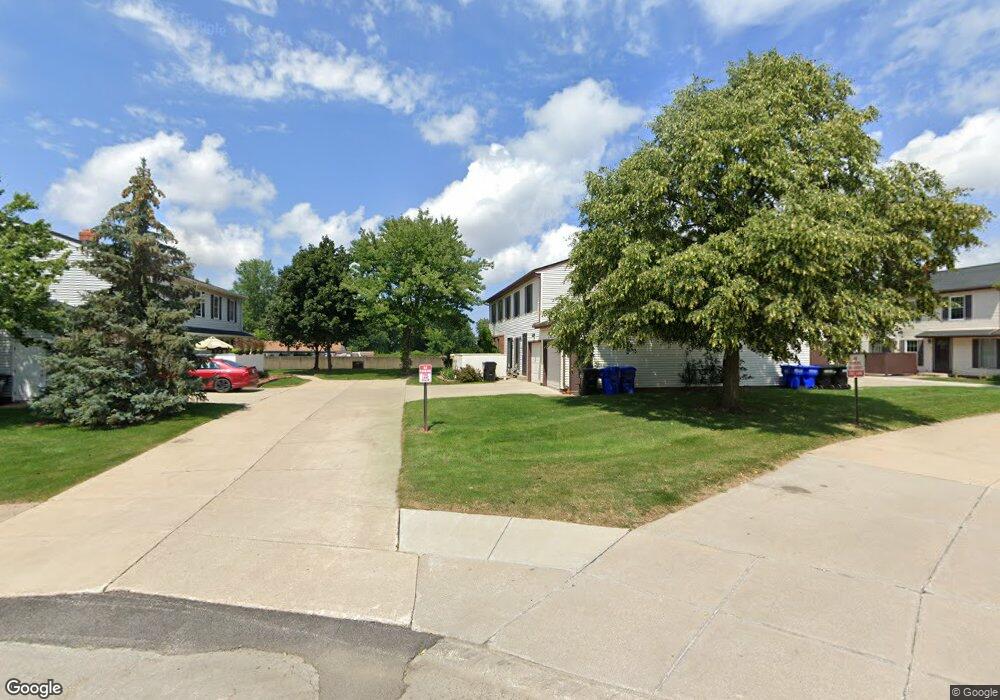
17326 Independence Ct Brookpark, OH 44142
Estimated Value: $134,610 - $165,000
2
Beds
2
Baths
924
Sq Ft
$166/Sq Ft
Est. Value
About This Home
This home is located at 17326 Independence Ct, Brookpark, OH 44142 and is currently estimated at $153,403, approximately $166 per square foot. 17326 Independence Ct is a home located in Cuyahoga County with nearby schools including Berea-Midpark Middle School, Berea-Midpark High School, and The Academy of St. Bartholomew.
Ownership History
Date
Name
Owned For
Owner Type
Purchase Details
Closed on
Sep 11, 2012
Sold by
Ruff Bonnie A
Bought by
Smolik Gerald W and Smolik Anna M
Current Estimated Value
Purchase Details
Closed on
Oct 21, 1997
Sold by
Ponchak Dale R
Bought by
Ruff Bonnie A
Home Financials for this Owner
Home Financials are based on the most recent Mortgage that was taken out on this home.
Original Mortgage
$46,000
Interest Rate
7.65%
Mortgage Type
New Conventional
Purchase Details
Closed on
Mar 26, 1991
Sold by
Kramer Richard L
Bought by
Ponchak Dale Richard
Purchase Details
Closed on
Dec 30, 1986
Bought by
Kramer Richard L
Purchase Details
Closed on
Jan 28, 1980
Sold by
Shearer Ralph L
Bought by
Broadway Gail K
Purchase Details
Closed on
Oct 26, 1979
Sold by
Downey Thomas W
Bought by
Shearer Ralph L
Purchase Details
Closed on
May 24, 1978
Sold by
Hilfer Robert and Lavernchik S
Bought by
Downey Thomas W
Purchase Details
Closed on
Jan 1, 1977
Bought by
Hilfer Robert and Hilfer Lavernchik S
Create a Home Valuation Report for This Property
The Home Valuation Report is an in-depth analysis detailing your home's value as well as a comparison with similar homes in the area
Home Values in the Area
Average Home Value in this Area
Purchase History
| Date | Buyer | Sale Price | Title Company |
|---|---|---|---|
| Smolik Gerald W | $53,500 | Maximum Title | |
| Ruff Bonnie A | $76,000 | -- | |
| Ponchak Dale Richard | $62,000 | -- | |
| Kramer Richard L | $43,000 | -- | |
| Broadway Gail K | -- | -- | |
| Shearer Ralph L | $46,800 | -- | |
| Downey Thomas W | $40,000 | -- | |
| Hilfer Robert | -- | -- |
Source: Public Records
Mortgage History
| Date | Status | Borrower | Loan Amount |
|---|---|---|---|
| Previous Owner | Ruff Bonnie A | $46,000 |
Source: Public Records
Tax History Compared to Growth
Tax History
| Year | Tax Paid | Tax Assessment Tax Assessment Total Assessment is a certain percentage of the fair market value that is determined by local assessors to be the total taxable value of land and additions on the property. | Land | Improvement |
|---|---|---|---|---|
| 2024 | $2,029 | $40,215 | $4,025 | $36,190 |
| 2023 | $1,766 | $28,990 | $2,910 | $26,080 |
| 2022 | $1,753 | $28,980 | $2,905 | $26,075 |
| 2021 | $1,743 | $28,980 | $2,910 | $26,080 |
| 2020 | $1,664 | $24,360 | $2,450 | $21,910 |
| 2019 | $1,614 | $69,600 | $7,000 | $62,600 |
| 2018 | $1,507 | $24,360 | $2,450 | $21,910 |
| 2017 | $1,523 | $21,320 | $2,140 | $19,180 |
| 2016 | $1,511 | $21,320 | $2,140 | $19,180 |
| 2015 | $1,772 | $21,320 | $2,140 | $19,180 |
| 2014 | $1,772 | $26,640 | $2,660 | $23,980 |
Source: Public Records
Map
Nearby Homes
- 6537 Liberty Bell Dr Unit 160
- 6577 Liberty Bell Dr Unit 20C
- 6366 Sandhurst Dr
- 6728 Benedict Dr
- 6740 Benedict Dr
- 6755 Benedict Dr
- 6401 Scott Dr
- 6748 Benedict Dr
- 6720 Benedict Dr
- 6744 Benedict Dr
- 6724 Benedict Dr
- 16193 Emerald Point Unit 16193
- 6465 Claudia Dr
- 16761 Orchard Grove Dr Unit 6808A
- 6421 Sylvia Dr
- 6736 Columbine Ct
- 16051 Holland Rd
- 6470 Sandfield Dr
- 6710 Woodruff Ct
- 15924 Richard Dr
- 17320 Independence Ct Unit 7B
- 17322 Independence Ct
- 17326 Independence Ct Unit 7D
- 17306 Independence Ct
- 17304 Independence Ct Unit 8A
- 17302 Independence Ct
- 17300 Independence Ct
- 17300 Independence Ct Unit 8-B
- 17302 Independence Ct Unit 8-C
- 17404 Independence Ct Unit 6A
- 17406 Independence Ct Unit 6D
- 17400 Independence Ct
- 17402 Independence Ct
- 17303 Independence Ct Unit 9D
- 17307 Independence Ct
- 17301 Independence Ct
- 17424 Independence Ct Unit 5A
- 17426 Independence Ct Unit 5D
- 17420 Independence Ct
- 17422 Independence Ct