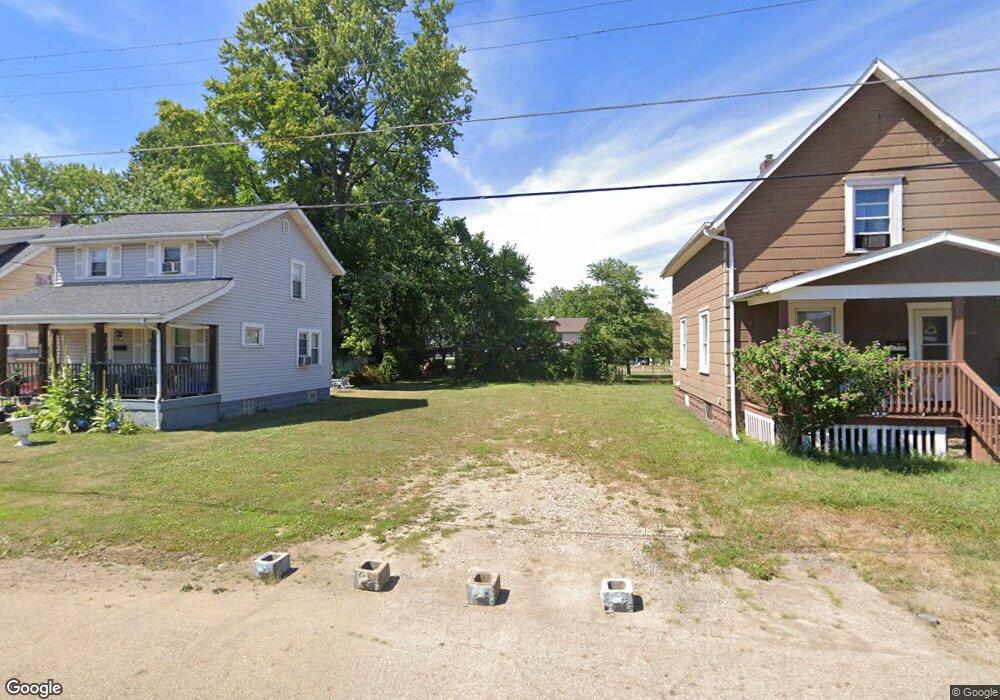
1733 Bonnot Place NE Canton, OH 44705
Gibbs Area NeighborhoodEstimated Value: $62,538 - $78,000
2
Beds
1
Bath
836
Sq Ft
$84/Sq Ft
Est. Value
About This Home
This home is located at 1733 Bonnot Place NE, Canton, OH 44705 and is currently estimated at $70,385, approximately $84 per square foot. 1733 Bonnot Place NE is a home located in Stark County with nearby schools including Early Learning Center @ Schreiber, Gibbs Elementary School, and Youtz Intermediate School.
Ownership History
Date
Name
Owned For
Owner Type
Purchase Details
Closed on
Dec 18, 2008
Sold by
Rose Land & Finance Corp
Bought by
Mcmeans Freddie E and Mcmeans Michelle A
Current Estimated Value
Home Financials for this Owner
Home Financials are based on the most recent Mortgage that was taken out on this home.
Original Mortgage
$30,902
Interest Rate
6.19%
Mortgage Type
Purchase Money Mortgage
Purchase Details
Closed on
Mar 18, 2008
Sold by
Wee Real Estate Company Ltd
Bought by
Rose Land & Finance Corp
Purchase Details
Closed on
Nov 3, 2006
Sold by
Cearfoss Richard A
Bought by
Wee Real Estate Co Llc
Purchase Details
Closed on
Jun 8, 2005
Sold by
Harr James M and Harr Marilyn
Bought by
Cearfoss Richard A
Purchase Details
Closed on
Mar 11, 2004
Sold by
The Bank Of New York
Bought by
Harr James M
Purchase Details
Closed on
Nov 10, 2003
Sold by
King George O and King Margaret G
Bought by
The Bank Of New York and Eqcc Trust 2001-2
Create a Home Valuation Report for This Property
The Home Valuation Report is an in-depth analysis detailing your home's value as well as a comparison with similar homes in the area
Home Values in the Area
Average Home Value in this Area
Purchase History
| Date | Buyer | Sale Price | Title Company |
|---|---|---|---|
| Mcmeans Freddie E | $30,000 | None Available | |
| Rose Land & Finance Corp | $30,000 | None Available | |
| Wee Real Estate Co Llc | $23,000 | None Available | |
| Cearfoss Richard A | $26,000 | -- | |
| Harr James M | $16,300 | Sovereign Title Agency Llc | |
| The Bank Of New York | $20,000 | Sovereign Title Agency Llc |
Source: Public Records
Mortgage History
| Date | Status | Borrower | Loan Amount |
|---|---|---|---|
| Closed | Mcmeans Freddie E | $30,902 | |
| Closed | Cearfoss Richard A | $0 |
Source: Public Records
Tax History Compared to Growth
Tax History
| Year | Tax Paid | Tax Assessment Tax Assessment Total Assessment is a certain percentage of the fair market value that is determined by local assessors to be the total taxable value of land and additions on the property. | Land | Improvement |
|---|---|---|---|---|
| 2025 | $18,252 | $670 | $670 | -- |
| 2024 | $17,295 | $670 | $670 | -- |
| 2023 | $16,845 | $670 | $670 | -- |
| 2022 | $12,150 | $8,970 | $1,370 | $7,600 |
| 2021 | $603 | $8,970 | $1,370 | $7,600 |
| 2020 | $473 | $7,150 | $1,090 | $6,060 |
| 2019 | $238 | $7,150 | $1,090 | $6,060 |
| 2018 | $416 | $7,150 | $1,090 | $6,060 |
| 2017 | $471 | $7,390 | $1,540 | $5,850 |
| 2016 | $473 | $7,390 | $1,540 | $5,850 |
| 2015 | $475 | $7,390 | $1,540 | $5,850 |
| 2014 | $518 | $7,570 | $1,580 | $5,990 |
| 2013 | $251 | $7,570 | $1,580 | $5,990 |
Source: Public Records
Map
Nearby Homes
- 1815 Virginia Place NE
- 1630 Bonnot Place NE
- 1643 Olive Place NE
- 1602 18th St NE
- 2005 17th St NE
- 1607 18th St NE
- 1517 16th St NE
- 2102 16th St NE
- 1515 Parkhill Place NE
- 1417 Harrisburg Rd NE
- 1607 20th St NE
- 2100 Maple Ave NE
- 1525 14th St NE
- 0 Dover Ave NE
- 2211 17th St NE
- 1734 Rowland Ave NE
- 2216 17th St NE
- 1447 Shriver Ave NE
- 1611 Rowland Ave NE
- 1219 17th St NE
- 1737 Bonnot Place NE
- 1727 Bonnot Place NE
- 1725 Bonnot Place NE
- 1805 Bonnot Place NE
- 1732 17th St NE
- 1723 Bonnot Place NE
- 1730 17th St NE
- 1724 17th St NE
- 1806 17th St NE
- 1809 Bonnot Place NE
- 1810 17th St NE
- 1718 17th St NE
- 1813 Bonnot Place NE
- 1714 17th St NE
- 1801 17th St NE
- 1725 17th St NE
- 1710 17th St NE
- 1733 Virginia Place NE
- 1733 17th St NE
- 1729 17th St NE