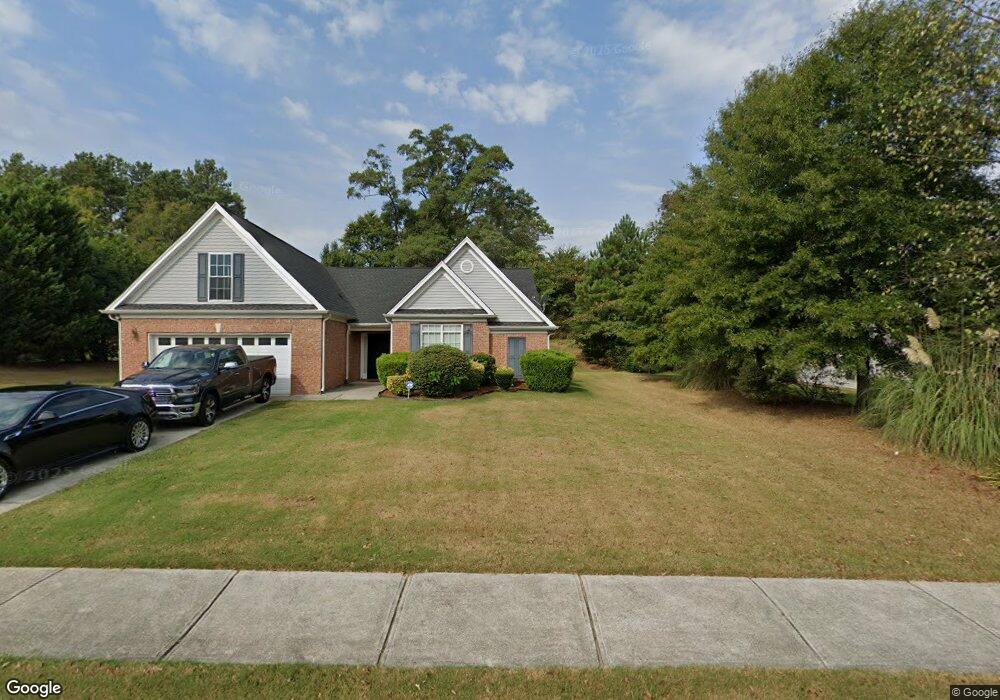
1733 Cedar Walk Ln Conley, GA 30288
Southwest DeKalb NeighborhoodEstimated Value: $260,000 - $329,000
3
Beds
3
Baths
2,269
Sq Ft
$132/Sq Ft
Est. Value
About This Home
This home is located at 1733 Cedar Walk Ln, Conley, GA 30288 and is currently estimated at $300,461, approximately $132 per square foot. 1733 Cedar Walk Ln is a home located in DeKalb County with nearby schools including Cedar Grove Elementary School, Cedar Grove Middle School, and Cedar Grove High School.
Ownership History
Date
Name
Owned For
Owner Type
Purchase Details
Closed on
Oct 25, 2018
Sold by
Burnett Elaine
Bought by
Shealey Elaine and Shealey Roderick Demetrius
Current Estimated Value
Purchase Details
Closed on
Apr 27, 2011
Sold by
Federal Natl Mtg Assn Fnma
Bought by
Burnett Elaine
Home Financials for this Owner
Home Financials are based on the most recent Mortgage that was taken out on this home.
Original Mortgage
$82,845
Interest Rate
5.5%
Mortgage Type
FHA
Purchase Details
Closed on
Dec 1, 2009
Sold by
James B Nutter & Co
Bought by
Federal Natl Mtg Assn Fnma
Purchase Details
Closed on
Nov 21, 2003
Sold by
Lifestyle Homebuilders Llc
Bought by
Morgan Mozelle
Home Financials for this Owner
Home Financials are based on the most recent Mortgage that was taken out on this home.
Original Mortgage
$151,200
Interest Rate
6.07%
Mortgage Type
New Conventional
Create a Home Valuation Report for This Property
The Home Valuation Report is an in-depth analysis detailing your home's value as well as a comparison with similar homes in the area
Home Values in the Area
Average Home Value in this Area
Purchase History
| Date | Buyer | Sale Price | Title Company |
|---|---|---|---|
| Shealey Elaine | -- | -- | |
| Burnett Elaine | -- | -- | |
| Federal Natl Mtg Assn Fnma | -- | -- | |
| James B Nutter Mortgage Co | $126,057 | -- | |
| Morgan Mozelle | $168,000 | -- |
Source: Public Records
Mortgage History
| Date | Status | Borrower | Loan Amount |
|---|---|---|---|
| Previous Owner | Burnett Elaine | $82,845 | |
| Previous Owner | Morgan Mozelle | $151,200 |
Source: Public Records
Tax History
| Year | Tax Paid | Tax Assessment Tax Assessment Total Assessment is a certain percentage of the fair market value that is determined by local assessors to be the total taxable value of land and additions on the property. | Land | Improvement |
|---|---|---|---|---|
| 2025 | $500 | $122,480 | $20,000 | $102,480 |
| 2024 | $488 | $112,880 | $20,000 | $92,880 |
| 2023 | $488 | $116,120 | $20,000 | $96,120 |
Source: Public Records
Map
Nearby Homes
- 4246 Cedar Lake Dr
- 1905 Cedar Walk Ln
- Everest III Plan at Cedar Grove Commons
- Westin Plan at Cedar Grove Commons
- Oakmont Plan at Cedar Grove Commons
- Zoey II Plan at Cedar Grove Commons
- 2029 Cedar Grove Rd
- 4375 Conley Landing
- 4205 Old House Dr
- 1983 Smithfield Ave
- 1775 Cedar Grove Rd
- 4212 Moore Rd Unit 4
- 2123 Cedar Grove Rd
- 4135 Moore Rd
- 2614 Brookgate Crossing
- 1677 Cedar Grove Rd
- 2264 Silver Maple Cir Unit 176
- 4290 Cedar Valley Ln
- 2089 Black Oak Ln
- 4310 Loveless Place
- 1737 Cedar Walk Ln
- 1729 Cedar Walk Ln
- 4242 Cedar Lake Dr
- 1929 Cedar Grove Rd
- 1741 Cedar Walk Ln
- 1732 Cedar Walk Ln
- 1932 Cedar Walk Ln
- 1725 Cedar Walk Ln
- 4238 Cedar Lake Dr
- 1736 Cedar Walk Ln
- 1745 Cedar Walk Ln
- 4232 Cedar Lake Dr
- 4214 Cedar Lake Dr
- 1740 Cedar Walk Ln
- 1721 Cedar Walk Ln
- 1928 Cedar Walk Ln
- 4252 Cedar Lake Dr
- 4226 Cedar Lake Dr
- 4210 Cedar Lake Dr
- 4220 Cedar Lake Dr