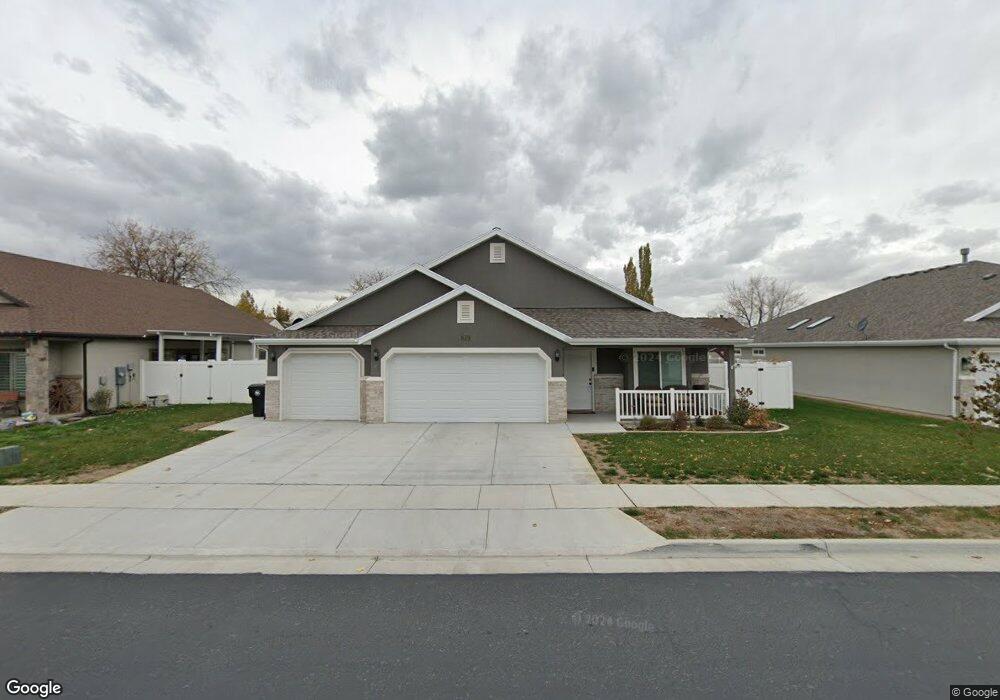
1733 N 690 W West Bountiful, UT 84087
Estimated Value: $667,940 - $717,000
2
Beds
3
Baths
2,251
Sq Ft
$304/Sq Ft
Est. Value
About This Home
This home is located at 1733 N 690 W, West Bountiful, UT 84087 and is currently estimated at $685,235, approximately $304 per square foot. 1733 N 690 W is a home with nearby schools including West Bountiful Elementary School, Bountiful Junior High School, and Viewmont High School.
Ownership History
Date
Name
Owned For
Owner Type
Purchase Details
Closed on
Oct 7, 2021
Sold by
Barmore Gary E and Barmore Sherry
Bought by
Barmore Gary and Barmore Sherry Reid
Current Estimated Value
Home Financials for this Owner
Home Financials are based on the most recent Mortgage that was taken out on this home.
Original Mortgage
$900,000
Interest Rate
3.05%
Purchase Details
Closed on
Jul 15, 2019
Sold by
Ovation Development Inc
Bought by
Barmore Gary E and Barmore Sherry
Home Financials for this Owner
Home Financials are based on the most recent Mortgage that was taken out on this home.
Original Mortgage
$448,169
Interest Rate
3.82%
Mortgage Type
Commercial
Create a Home Valuation Report for This Property
The Home Valuation Report is an in-depth analysis detailing your home's value as well as a comparison with similar homes in the area
Home Values in the Area
Average Home Value in this Area
Purchase History
| Date | Buyer | Sale Price | Title Company |
|---|---|---|---|
| Barmore Gary | -- | Mountain View Title | |
| Barmore Gary E | -- | Aspen Title Insuran |
Source: Public Records
Mortgage History
| Date | Status | Borrower | Loan Amount |
|---|---|---|---|
| Closed | Barmore Gary | $900,000 | |
| Closed | Barmore Gary | $900,000 | |
| Closed | Barmore Gary E | $448,169 |
Source: Public Records
Tax History Compared to Growth
Tax History
| Year | Tax Paid | Tax Assessment Tax Assessment Total Assessment is a certain percentage of the fair market value that is determined by local assessors to be the total taxable value of land and additions on the property. | Land | Improvement |
|---|---|---|---|---|
| 2025 | $4,001 | $360,800 | $120,615 | $240,185 |
| 2024 | $3,483 | $319,000 | $98,680 | $220,320 |
| 2023 | $3,623 | $608,000 | $190,300 | $417,700 |
| 2022 | $3,696 | $346,500 | $88,426 | $258,074 |
| 2021 | $0 | $524,000 | $114,208 | $409,792 |
| 2020 | $3,185 | $455,000 | $109,946 | $345,054 |
| 2019 | $1,035 | $136,203 | $114,203 | $22,000 |
| 2018 | $1,699 | $119,603 | $119,603 | $0 |
Source: Public Records
Map
Nearby Homes