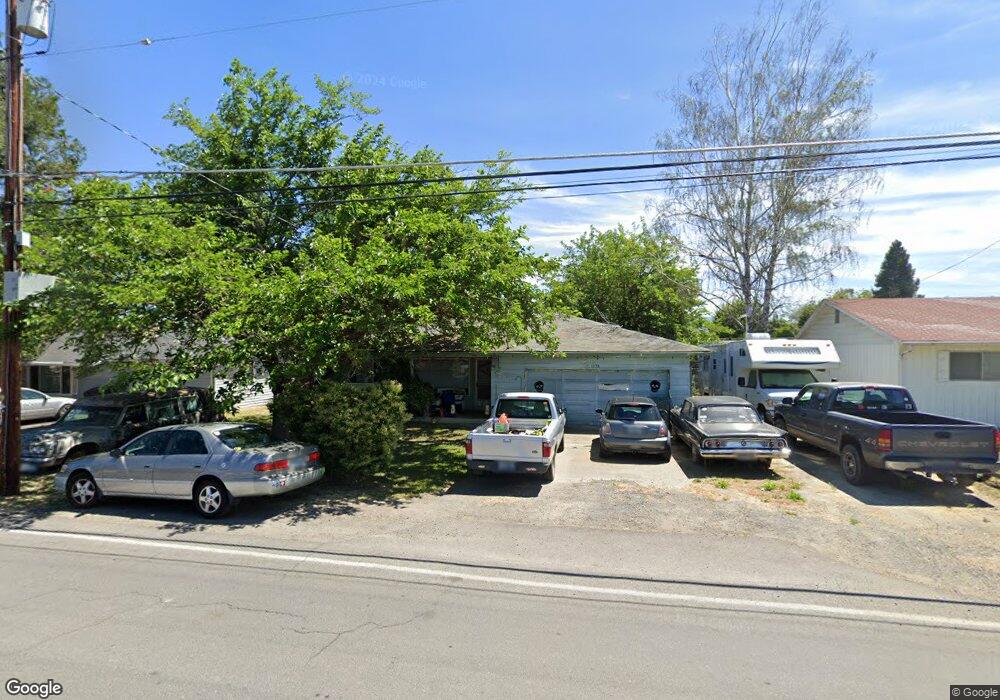
1733 S Peach St Medford, OR 97501
Southwest Medford NeighborhoodEstimated Value: $361,000 - $412,000
3
Beds
2
Baths
1,360
Sq Ft
$293/Sq Ft
Est. Value
About This Home
This home is located at 1733 S Peach St, Medford, OR 97501 and is currently estimated at $398,215, approximately $292 per square foot. 1733 S Peach St is a home located in Jackson County with nearby schools including Jefferson Elementary School, McLoughlin Middle School, and South Medford High School.
Ownership History
Date
Name
Owned For
Owner Type
Purchase Details
Closed on
Feb 26, 2016
Sold by
Overton Cynthia E
Bought by
Sampo Kelly A and Sampo Ricky A
Current Estimated Value
Home Financials for this Owner
Home Financials are based on the most recent Mortgage that was taken out on this home.
Original Mortgage
$40,000
Outstanding Balance
$31,628
Interest Rate
3.62%
Estimated Equity
$366,587
Purchase Details
Closed on
Aug 5, 2002
Sold by
Plankenhorn Dorene G
Bought by
Innes James D
Home Financials for this Owner
Home Financials are based on the most recent Mortgage that was taken out on this home.
Original Mortgage
$92,000
Interest Rate
6.52%
Create a Home Valuation Report for This Property
The Home Valuation Report is an in-depth analysis detailing your home's value as well as a comparison with similar homes in the area
Home Values in the Area
Average Home Value in this Area
Purchase History
| Date | Buyer | Sale Price | Title Company |
|---|---|---|---|
| Sampo Kelly A | $15,000 | -- | |
| Innes James D | $126,000 | Amerititle Inc |
Source: Public Records
Mortgage History
| Date | Status | Borrower | Loan Amount |
|---|---|---|---|
| Open | Sampo Kelly A | $40,000 | |
| Closed | Sampo Kelly A | -- | |
| Previous Owner | Innes James D | $92,000 |
Source: Public Records
Tax History Compared to Growth
Tax History
| Year | Tax Paid | Tax Assessment Tax Assessment Total Assessment is a certain percentage of the fair market value that is determined by local assessors to be the total taxable value of land and additions on the property. | Land | Improvement |
|---|---|---|---|---|
| 2025 | $3,069 | $211,650 | $109,620 | $102,030 |
| 2024 | $3,069 | $205,490 | $106,430 | $99,060 |
| 2023 | $2,976 | $199,510 | $103,330 | $96,180 |
| 2022 | $2,903 | $199,510 | $103,330 | $96,180 |
| 2021 | $2,828 | $193,700 | $100,320 | $93,380 |
| 2020 | $2,768 | $188,060 | $97,400 | $90,660 |
| 2019 | $2,703 | $177,280 | $91,810 | $85,470 |
| 2018 | $2,634 | $172,120 | $89,140 | $82,980 |
| 2017 | $2,586 | $172,120 | $89,140 | $82,980 |
| 2016 | $2,603 | $162,250 | $84,020 | $78,230 |
| 2015 | $2,502 | $162,250 | $84,020 | $78,230 |
| 2014 | $2,458 | $152,950 | $79,210 | $73,740 |
Source: Public Records
Map
Nearby Homes
- 877 Garfield St
- 871 Marshall Ave
- 1826 Hart Ave
- 1007 Garfield St
- 1687 Lillian St
- 1010 Garfield St
- 0 Garfield St Unit 220210927
- 1066 Diamond St
- 1570 S Peach St Unit 115
- 1570 S Peach St Unit SPC 106
- 1822 Sarah Way
- 1967 Hart Ave
- 730 Aspen St
- 1157 Peachwood Ct
- 1595 S Columbus Ave
- 2010 Kings Hwy
- 990 Janes Rd
- 848 Trinity Way
- 757 Agate St
- 1310 Brentcrest Dr