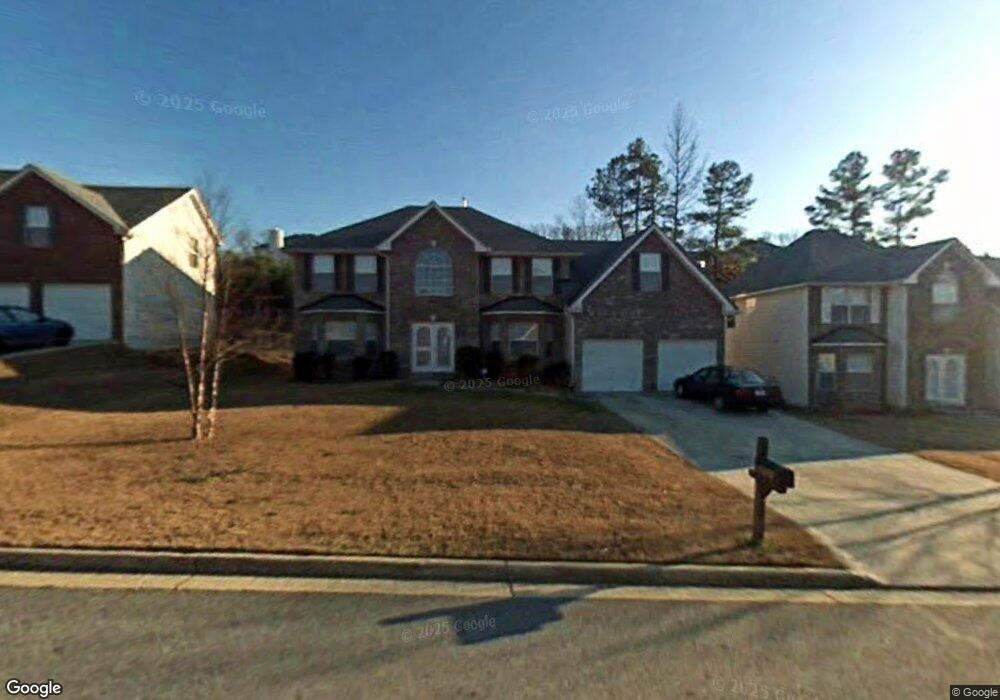
1733 Spring Hill Cove Lithonia, GA 30058
Estimated Value: $304,506 - $362,000
5
Beds
3
Baths
2,592
Sq Ft
$124/Sq Ft
Est. Value
About This Home
This home is located at 1733 Spring Hill Cove, Lithonia, GA 30058 and is currently estimated at $322,377, approximately $124 per square foot. 1733 Spring Hill Cove is a home located in DeKalb County with nearby schools including Princeton Elementary School, Lithonia Middle School, and Lithonia High School.
Ownership History
Date
Name
Owned For
Owner Type
Purchase Details
Closed on
Jul 22, 2011
Sold by
Secretary Of Housing And U
Bought by
Blowe Carlene
Current Estimated Value
Home Financials for this Owner
Home Financials are based on the most recent Mortgage that was taken out on this home.
Original Mortgage
$110,000
Outstanding Balance
$75,712
Interest Rate
4.52%
Mortgage Type
FHA
Estimated Equity
$246,665
Purchase Details
Closed on
Dec 7, 2010
Sold by
Citimortgage Inc
Bought by
Hud-Housing Of Urban Dev
Purchase Details
Closed on
Oct 4, 2002
Sold by
Legacy Communities Roger Xing Ll
Bought by
Robinson Jennifer and Robinson Mattie
Home Financials for this Owner
Home Financials are based on the most recent Mortgage that was taken out on this home.
Original Mortgage
$177,754
Interest Rate
5.93%
Mortgage Type
FHA
Create a Home Valuation Report for This Property
The Home Valuation Report is an in-depth analysis detailing your home's value as well as a comparison with similar homes in the area
Home Values in the Area
Average Home Value in this Area
Purchase History
| Date | Buyer | Sale Price | Title Company |
|---|---|---|---|
| Blowe Carlene | $110,000 | -- | |
| Hud-Housing Of Urban Dev | -- | -- | |
| Citimortgage Inc | $207,114 | -- | |
| Robinson Jennifer | $179,200 | -- |
Source: Public Records
Mortgage History
| Date | Status | Borrower | Loan Amount |
|---|---|---|---|
| Open | Blowe Carlene | $110,000 | |
| Previous Owner | Robinson Jennifer | $177,754 |
Source: Public Records
Tax History Compared to Growth
Tax History
| Year | Tax Paid | Tax Assessment Tax Assessment Total Assessment is a certain percentage of the fair market value that is determined by local assessors to be the total taxable value of land and additions on the property. | Land | Improvement |
|---|---|---|---|---|
| 2025 | $3,186 | $113,320 | $14,400 | $98,920 |
| 2024 | $3,443 | $121,640 | $14,400 | $107,240 |
| 2023 | $3,443 | $119,960 | $14,400 | $105,560 |
| 2022 | $3,062 | $109,280 | $9,360 | $99,920 |
| 2021 | $2,431 | $80,760 | $9,360 | $71,400 |
| 2020 | $2,226 | $72,640 | $9,360 | $63,280 |
| 2019 | $2,121 | $67,360 | $9,360 | $58,000 |
| 2018 | $1,727 | $60,440 | $9,360 | $51,080 |
| 2017 | $2,028 | $60,360 | $9,360 | $51,000 |
| 2016 | $1,740 | $52,920 | $9,360 | $43,560 |
| 2014 | $1,056 | $33,080 | $4,360 | $28,720 |
Source: Public Records
Map
Nearby Homes
- 1362 Rogers Trace
- 1370 Rogers Trace
- 1512 Rogers Preserve Rd
- 1528 Rogers Crossing Dr
- 6987 Dalehollow Dr
- 6941 Rogers Point
- 6956 Rogers Point
- 1435 Rogers Lake Rd
- 6843 Hill Creek Cove
- 6856 Hill Creek Cove
- 1476 Cutters Mill Dr
- 1596 Cutters Mill Dr
- 1593 Cutters Mill Dr
- 1213 Oak Knoll Ct
- 1286 Regal Heights Dr
- 7169 Sweet Gum Ct
- 1399 Cutters Mill Dr
- 1309 Sandybrook Ct
- 2150 Mulberry Ln
- 2146 Mulberry Ln Unit 2
- 1727 Spring Hill Cove
- 1739 Spring Hill Cove
- 1721 Spring Hill Cove
- 1745 Spring Hill Cove
- 1568 Rogers Crossing Dr
- 1576 Rogers Crossing Dr
- 1734 Spring Hill Cove
- 1728 Spring Hill Cove
- 1740 Spring Hill Cove
- 1722 Spring Hill Cove
- 1560 Rogers Crossing Dr
- 1751 Spring Hill Cove
- 1584 Rogers Crossing Dr
- 1746 Spring Hill Cove
- 1715 Spring Hill Cove
- 1347 Rogers Trace
- 1347 Rogers Trace Unit Tr
- 1345 Rogers Trace
- 1343 Rogers Trace
- 1552 Rogers Crossing Dr