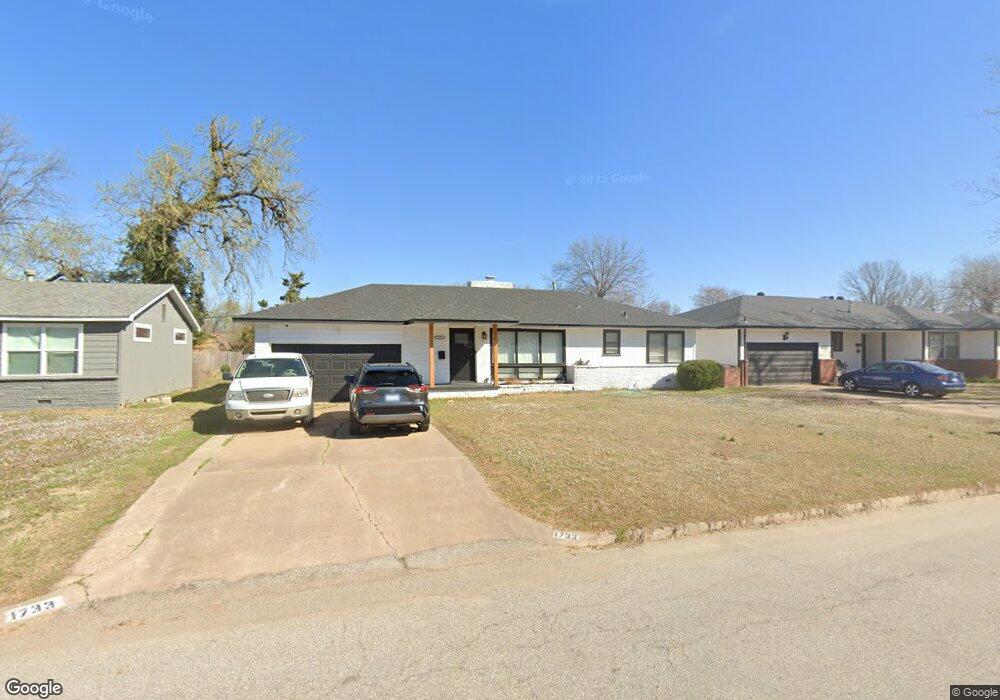
1733 W Haskell Place Tulsa, OK 74127
Gilcrease Hills NeighborhoodEstimated Value: $123,000 - $272,000
3
Beds
2
Baths
1,716
Sq Ft
$115/Sq Ft
Est. Value
About This Home
This home is located at 1733 W Haskell Place, Tulsa, OK 74127 and is currently estimated at $196,507, approximately $114 per square foot. 1733 W Haskell Place is a home located in Osage County with nearby schools including Greenwood Leadership Academy, Central Middle School, and Central Junior High School.
Ownership History
Date
Name
Owned For
Owner Type
Purchase Details
Closed on
Feb 2, 2017
Sold by
Thompson Dickey N
Bought by
Thompson Shelia B
Current Estimated Value
Purchase Details
Closed on
Jul 20, 2009
Sold by
Gilliam Lloyd
Bought by
Williams Billy T
Home Financials for this Owner
Home Financials are based on the most recent Mortgage that was taken out on this home.
Original Mortgage
$82,478
Outstanding Balance
$54,696
Interest Rate
5.71%
Mortgage Type
FHA
Estimated Equity
$141,811
Purchase Details
Closed on
May 13, 2008
Sold by
Federal National Mortgage Association
Bought by
Gilliam Lloyd
Purchase Details
Closed on
Sep 26, 2005
Sold by
Tipton Sandy and Tipton Russell
Bought by
Maroney Mark A
Home Financials for this Owner
Home Financials are based on the most recent Mortgage that was taken out on this home.
Original Mortgage
$50,000
Interest Rate
5.73%
Mortgage Type
New Conventional
Purchase Details
Closed on
Nov 6, 2004
Sold by
Couch Charleene
Bought by
Maroney Mark A Etal
Create a Home Valuation Report for This Property
The Home Valuation Report is an in-depth analysis detailing your home's value as well as a comparison with similar homes in the area
Home Values in the Area
Average Home Value in this Area
Purchase History
| Date | Buyer | Sale Price | Title Company |
|---|---|---|---|
| Thompson Shelia B | -- | None Available | |
| Williams Billy T | $84,000 | -- | |
| Gilliam Lloyd | $33,000 | -- | |
| Maroney Mark A | -- | None Available | |
| Maroney Mark A Etal | -- | -- |
Source: Public Records
Mortgage History
| Date | Status | Borrower | Loan Amount |
|---|---|---|---|
| Open | Williams Billy T | $82,478 | |
| Previous Owner | Maroney Mark A | $50,000 |
Source: Public Records
Tax History Compared to Growth
Tax History
| Year | Tax Paid | Tax Assessment Tax Assessment Total Assessment is a certain percentage of the fair market value that is determined by local assessors to be the total taxable value of land and additions on the property. | Land | Improvement |
|---|---|---|---|---|
| 2025 | $1,335 | $11,113 | $567 | $10,546 |
| 2024 | $1,224 | $10,584 | $540 | $10,044 |
| 2023 | $1,224 | $10,584 | $540 | $10,044 |
| 2022 | $1,254 | $10,584 | $540 | $10,044 |
| 2021 | $1,240 | $10,584 | $540 | $10,044 |
| 2020 | $1,221 | $10,584 | $540 | $10,044 |
| 2019 | $1,299 | $10,584 | $540 | $10,044 |
| 2018 | $1,301 | $10,584 | $540 | $10,044 |
| 2017 | $1,304 | $10,584 | $540 | $10,044 |
| 2016 | $1,273 | $10,575 | $540 | $10,035 |
| 2015 | $1,262 | $10,575 | $540 | $10,035 |
| 2014 | -- | $10,575 | $540 | $10,035 |
| 2013 | $1,206 | $10,575 | $540 | $10,035 |
Source: Public Records
Map
Nearby Homes
- 644 N Xenophon Ave
- 582 N Xenophon Ave
- 1736 W Latimer Place
- 704 N Zenith Ave
- 1805 W Easton St
- 2015 W Easton St
- 328 N Santa fe Ave
- 1315 W Easton St
- 1815 W Cameron St
- 549 N 23rd West Ave
- 2016 W Easton St
- 610 W Fairview St
- 2320 W Easton Ct
- 254 N Yukon Ave
- 0 N Quanah Ave
- 1717 W Newton St
- 1204 W Marshall St
- 1224 N Rosedale Ave
- 1114 W Marshall St
- 1415 W Reconciliation Way
- 1739 W Haskell Place
- 1729 W Haskell Place
- 1736 W Independence St
- 1804 W Independence St
- 1730 W Independence St
- 1745 W Haskell Place
- 1734 W Haskell Place
- 1810 W Independence St
- 1730 W Haskell Place
- 1740 W Haskell Place
- 1751 W Haskell Place
- 1746 W Haskell Place
- 1724 W Haskell Place
- 1814 W Independence St
- 1715 W Haskell Place
- 753 N Union Place
- 1757 W Haskell Place
- 1733 W Independence St
- 721 N Waco Ave
- 725 N Union Place