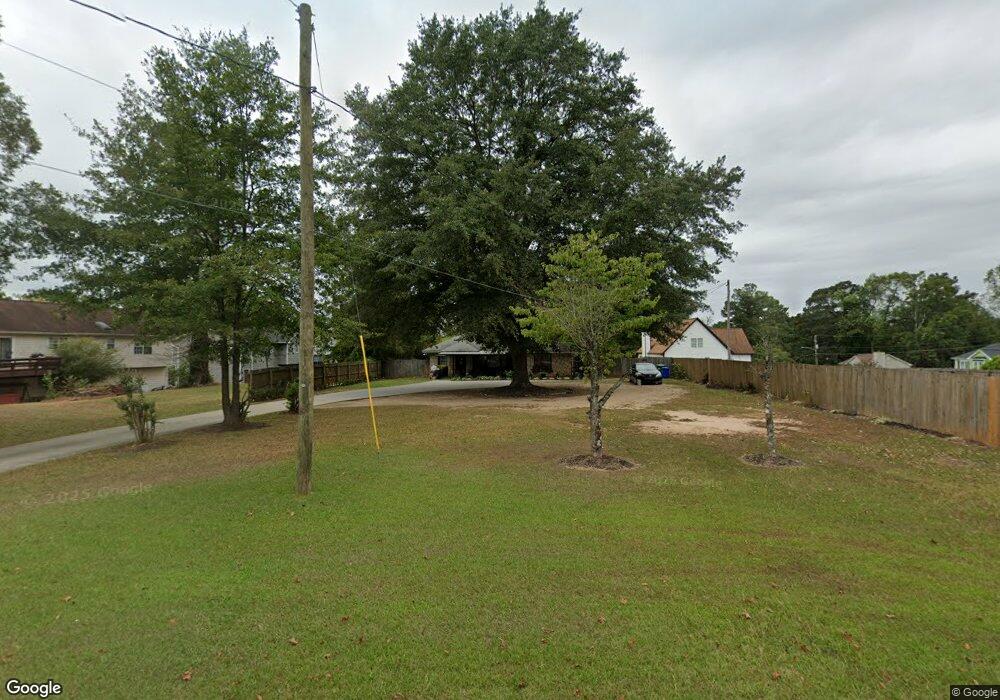
1733 Wellborn Rd Lithonia, GA 30058
Estimated Value: $184,000 - $245,000
3
Beds
2
Baths
1,548
Sq Ft
$137/Sq Ft
Est. Value
About This Home
This home is located at 1733 Wellborn Rd, Lithonia, GA 30058 and is currently estimated at $211,592, approximately $136 per square foot. 1733 Wellborn Rd is a home located in DeKalb County with nearby schools including Redan Elementary School, Lithonia Middle School, and Lithonia High School.
Ownership History
Date
Name
Owned For
Owner Type
Purchase Details
Closed on
Mar 27, 2014
Sold by
Rlm Real Estate Management
Bought by
Miller Holdings And Investment
Current Estimated Value
Purchase Details
Closed on
Mar 24, 2014
Sold by
R L M Properties Llc
Bought by
Miller Holdings And Investment
Purchase Details
Closed on
Feb 23, 2011
Sold by
Cpi Housing Fund Llc
Bought by
Rlm Properties Llc
Purchase Details
Closed on
Nov 24, 2010
Sold by
Federal Natl Mtg Assn Fnma
Bought by
Cpi Housing Llc
Purchase Details
Closed on
Aug 3, 2010
Sold by
Citimortgage Inc
Bought by
Federal Natl Mtg Assn Fnma
Purchase Details
Closed on
Mar 2, 2010
Sold by
Citimortgage Inc
Bought by
Federal Natl Mtg Assn Fnma
Purchase Details
Closed on
Jun 15, 2006
Sold by
Sims H Lewis
Bought by
Sims H Lewis and Sims Linda
Home Financials for this Owner
Home Financials are based on the most recent Mortgage that was taken out on this home.
Original Mortgage
$65,000
Interest Rate
6.49%
Mortgage Type
New Conventional
Create a Home Valuation Report for This Property
The Home Valuation Report is an in-depth analysis detailing your home's value as well as a comparison with similar homes in the area
Home Values in the Area
Average Home Value in this Area
Purchase History
| Date | Buyer | Sale Price | Title Company |
|---|---|---|---|
| Miller Holdings And Investment | -- | -- | |
| Miller Holdings And Investment | -- | -- | |
| Miller Holdings And Investment | -- | -- | |
| Rlm Properties Llc | $17,000 | -- | |
| Cpi Housing Llc | $12,000 | -- | |
| Federal Natl Mtg Assn Fnma | -- | -- | |
| Federal Natl Mtg Assn Fnma | -- | -- | |
| Citimortgage Inc | $64,073 | -- | |
| Federal Natl Mtg Assn Fnma | -- | -- | |
| Citimortgage | $64,073 | -- | |
| Sims H Lewis | -- | -- |
Source: Public Records
Mortgage History
| Date | Status | Borrower | Loan Amount |
|---|---|---|---|
| Previous Owner | Sims H Lewis | $65,000 |
Source: Public Records
Tax History Compared to Growth
Tax History
| Year | Tax Paid | Tax Assessment Tax Assessment Total Assessment is a certain percentage of the fair market value that is determined by local assessors to be the total taxable value of land and additions on the property. | Land | Improvement |
|---|---|---|---|---|
| 2025 | $4,060 | $81,920 | $15,680 | $66,240 |
| 2024 | $3,974 | $80,040 | $15,680 | $64,360 |
| 2023 | $3,974 | $69,760 | $15,680 | $54,080 |
| 2022 | $2,968 | $59,280 | $15,680 | $43,600 |
| 2021 | $1,738 | $31,240 | $8,960 | $22,280 |
| 2020 | $1,666 | $29,600 | $8,960 | $20,640 |
| 2019 | $1,366 | $22,760 | $8,960 | $13,800 |
| 2018 | $1,128 | $24,120 | $8,960 | $15,160 |
| 2017 | $1,410 | $22,920 | $8,960 | $13,960 |
| 2016 | $1,377 | $22,080 | $8,960 | $13,120 |
| 2014 | $618 | $11,400 | $1,240 | $10,160 |
Source: Public Records
Map
Nearby Homes
- 6024 S Deshon Ct
- 1667 Wellborn Rd
- 1760 Waterton Ln
- 6060 Waterton Dr
- 5969 Bretton Woods Dr
- 6102 Waterton Dr
- 5934 S Deshon Ct
- 5928 S Deshon Ct
- 5940 Fairfield Estates Dr
- 6124 Waterton Dr Unit 1
- 5925 Bretton Woods Dr
- 6232 Springwater Ln Unit 1
- 5919 Duren Farms Cir
- 5964 Giles Rd
- 5972 Giles Rd
- 1629 Phillips Rd
- 5822 Giles Rd
- 5827 Christopher Ln
- 5851 Giles Rd
- 5789 Dorian Ct
- 6021 S Deshon Ct
- 6022 Bretton Woods Dr
- 6030 Bretton Woods Dr
- 6009 S Deshon Ct
- 6014 Bretton Woods Dr
- 6032 S Deshon Ct
- 6008 Bretton Woods Dr
- 6016 S Deshon Ct
- 1761 Waterton Ln
- 6046 Waterton Dr Unit 1
- 6003 S Deshon Ct
- 6029 Bretton Woods Dr
- 6010 S Deshon Ct
- 6000 Bretton Woods Dr
- 6017 Bretton Woods Dr
- 6045 Waterton Dr Unit 1
- 5997 S Deshon Ct
- 6011 Bretton Woods Dr
- 6004 S Deshon Ct
- 1742 Wellborn Rd Unit 1