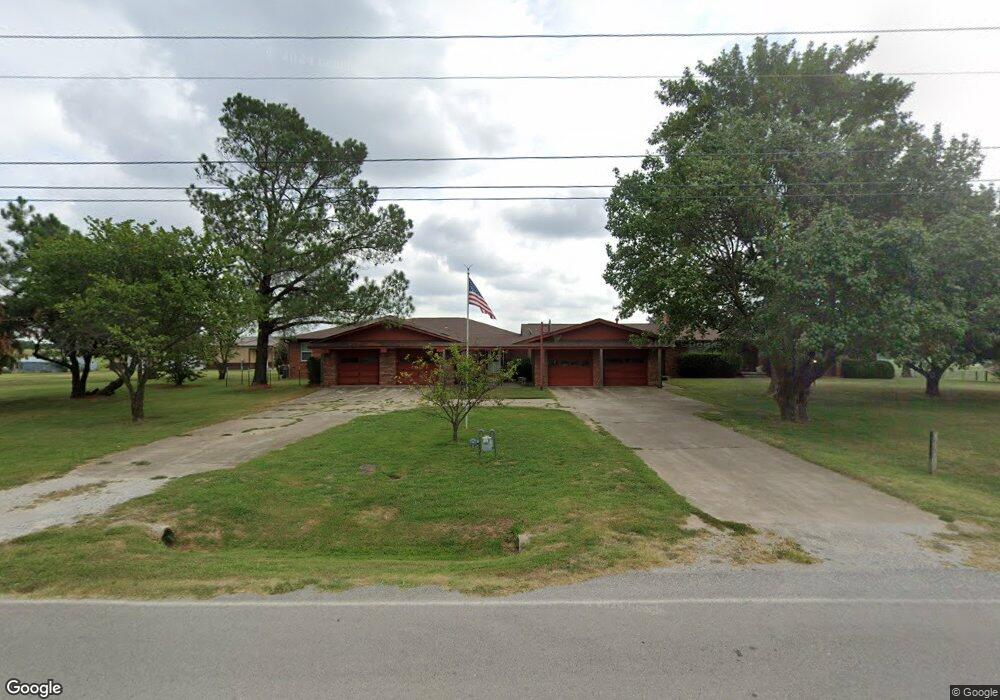
17331 S Peoria Ave Mounds, OK 74047
Estimated Value: $621,290 - $923,000
--
Bed
6
Baths
5,698
Sq Ft
$136/Sq Ft
Est. Value
About This Home
This home is located at 17331 S Peoria Ave, Mounds, OK 74047 and is currently estimated at $772,145, approximately $135 per square foot. 17331 S Peoria Ave is a home located in Tulsa County with nearby schools including Central Elementary School and Bixby Central Intermediate School.
Ownership History
Date
Name
Owned For
Owner Type
Purchase Details
Closed on
Nov 4, 2021
Sold by
Don Driscoll J and Don Betsy
Bought by
Garrett Caleb and Garrett Kelsey
Current Estimated Value
Purchase Details
Closed on
Jul 12, 2010
Sold by
Driscoll J Don and Driscoll Betsy S
Bought by
Driscoll J Don and J Don Driscoll Revocable Inter Vivos Tru
Home Financials for this Owner
Home Financials are based on the most recent Mortgage that was taken out on this home.
Original Mortgage
$165,600
Interest Rate
4.78%
Mortgage Type
New Conventional
Purchase Details
Closed on
Dec 7, 2001
Sold by
Driscoll J Don and Driscoll Betsy S
Bought by
Driscoll J Don and J Don Driscoll Revocable Trust
Purchase Details
Closed on
Mar 23, 2001
Sold by
Driscoll J Don
Bought by
Driscoll J Don and Driscoll Betsy S
Home Financials for this Owner
Home Financials are based on the most recent Mortgage that was taken out on this home.
Original Mortgage
$175,500
Interest Rate
6.98%
Create a Home Valuation Report for This Property
The Home Valuation Report is an in-depth analysis detailing your home's value as well as a comparison with similar homes in the area
Home Values in the Area
Average Home Value in this Area
Purchase History
| Date | Buyer | Sale Price | Title Company |
|---|---|---|---|
| Garrett Caleb | -- | Frisco Title | |
| Driscoll J Don | -- | None Available | |
| Driscoll J Don | -- | None Available | |
| Driscoll J Don | -- | Tulsa Abstract & Title Co | |
| Driscoll J Don | -- | -- |
Source: Public Records
Mortgage History
| Date | Status | Borrower | Loan Amount |
|---|---|---|---|
| Previous Owner | Driscoll J Don | $165,600 | |
| Previous Owner | Driscoll J Don | $175,500 |
Source: Public Records
Tax History Compared to Growth
Tax History
| Year | Tax Paid | Tax Assessment Tax Assessment Total Assessment is a certain percentage of the fair market value that is determined by local assessors to be the total taxable value of land and additions on the property. | Land | Improvement |
|---|---|---|---|---|
| 2025 | $3,394 | $29,035 | $58 | $28,977 |
| 2024 | $3,428 | $29,035 | $58 | $28,977 |
| 2023 | $3,428 | $30,035 | $60 | $29,975 |
| 2022 | $3,363 | $28,266 | $56 | $28,210 |
| 2021 | $3,249 | $27,414 | $118 | $27,296 |
| 2020 | $3,163 | $26,586 | $114 | $26,472 |
| 2019 | $2,891 | $24,180 | $109 | $24,071 |
| 2018 | $2,791 | $23,447 | $106 | $23,341 |
| 2017 | $2,671 | $23,735 | $129 | $23,606 |
| 2016 | $2,680 | $23,735 | $129 | $23,606 |
| 2015 | $2,525 | $23,735 | $129 | $23,606 |
| 2014 | $2,513 | $23,735 | $129 | $23,606 |
Source: Public Records
Map
Nearby Homes
- 16928 S Peoria Ave
- 1992 E 173rd St S
- 17243 S 21st East Ave
- 207 W 172nd St S
- 16501 S 4th East Ave
- 0 S Peoria Ave Unit 2512558
- 213 E 166th Place
- 313 E 165th Place S
- 201 E 165th Place S
- 88 E 165th Place S
- 103 E 165th Place S
- 25 W 166th Place S
- 16516 S 1st East Ct
- 89 E 165th Place S
- 84 E 165th Place S
- 101 E 165th St S
- 213 E 165th Place S
- 100 E 164th Place S
- 16412 S 1st East Ct
- 16503 S 1st West Ave
- 17349 S Peoria Ave
- 5 S Peoria Ave
- 4 S Peoria Ave
- 2 S Peoria Ave
- 1 S Peoria Ave
- 3 S Peoria Ave
- 17314 S Peoria Ave
- 17302 S Peoria Ave
- 17408 S Peoria Ave
- 17201 S Peoria Ave
- 17515 S Peoria Ave
- 17220 S Peoria Ave
- 17111 S Peoria Ave
- 17318 S Peoria Ave
- 910 E 171st St S
- Tr 4/ 2424 E 171st St S
- 1280 E 171st St S
- 1622 E 171st St S
- 17625 S Peoria Ave
- 17012 S Peoria Ave