17332 Walter St Lansing, IL 60438
Estimated Value: $151,000 - $161,000
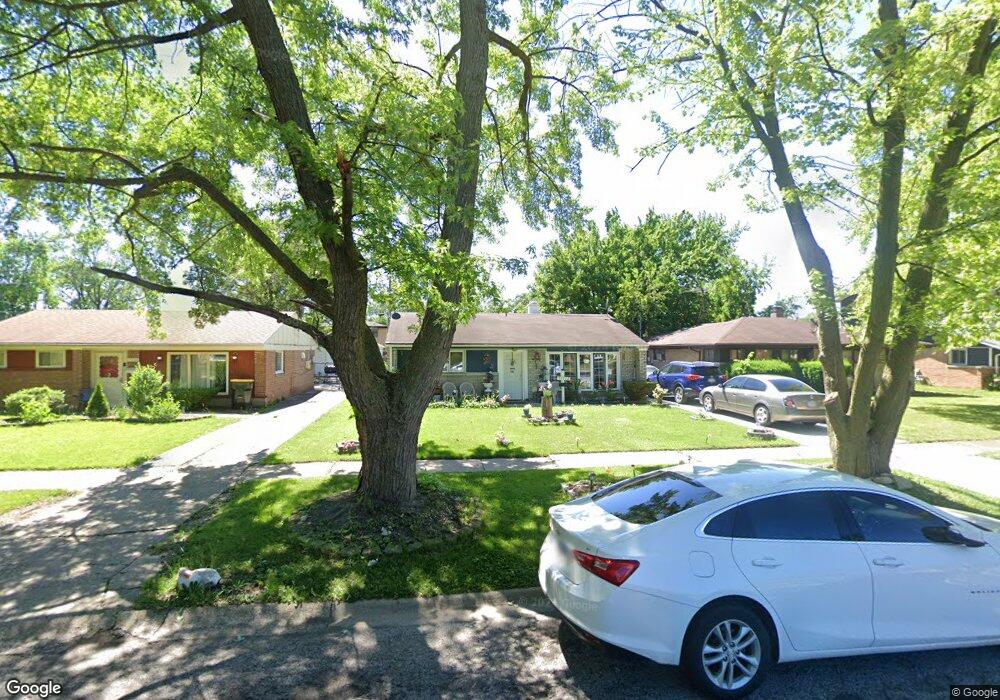
About This Home
This home is located at 17332 Walter St, Lansing, IL 60438 and is currently estimated at $156,966, approximately $122 per square foot. 17332 Walter St is a home located in Cook County with nearby schools including Reavis Elementary School, Memorial Jr High School, and Thornton Fractnl So High School.
Ownership History
We collect this data history from publicly available records. To have your information removed, we recommend requesting removal directly through your county’s website.
Purchase Details
Home Financials for this Owner
Home Financials are based on the most recent Mortgage that was taken out on this home.Purchase Details
Purchase Details
Purchase Details
Purchase Details
Home Financials for this Owner
Home Financials are based on the most recent Mortgage that was taken out on this home.Home Values in the Area
Average Home Value in this Area
Purchase History
We collect this data history from publicly available records. To have your information removed, we recommend requesting removal directly through your county’s website.
| Date | Buyer | Sale Price | Title Company |
|---|---|---|---|
| $65,000 | Cti | ||
| $49,500 | None Available | ||
| -- | None Available | ||
| -- | None Available | ||
| $103,000 | Pntn |
Mortgage History
We collect this data history from publicly available records. To have your information removed, we recommend requesting removal directly through your county’s website.
| Date | Status | Borrower | Loan Amount |
|---|---|---|---|
| Open | $63,352 | ||
| Previous Owner | $97,850 |
Tax History
We collect this data history from publicly available records. To have your information removed, we recommend requesting removal directly through your county’s website.
| Year | Tax Paid | Tax Assessment Tax Assessment Total Assessment is a certain percentage of the fair market value that is determined by local assessors to be the total taxable value of land and additions on the property. | Land | Improvement |
|---|---|---|---|---|
| 2025 | $3,234 | $10,000 | $2,440 | $7,560 |
| 2024 | $3,234 | $10,000 | $2,440 | $7,560 |
| 2023 | $2,421 | $10,000 | $2,440 | $7,560 |
| 2022 | $2,421 | $7,147 | $2,135 | $5,012 |
| 2021 | $2,412 | $7,146 | $2,135 | $5,011 |
| 2020 | $2,372 | $7,146 | $2,135 | $5,011 |
| 2019 | $2,747 | $8,254 | $1,982 | $6,272 |
| 2018 | $2,693 | $8,254 | $1,982 | $6,272 |
| 2017 | $2,753 | $8,254 | $1,982 | $6,272 |
| 2016 | $2,551 | $7,162 | $1,830 | $5,332 |
| 2015 | $2,306 | $7,162 | $1,830 | $5,332 |
| 2014 | $2,302 | $7,162 | $1,830 | $5,332 |
| 2013 | $2,475 | $8,125 | $1,830 | $6,295 |
Map
- 17318 Walter St
- 17256 Walter St
- 17303 Greenbay Ave
- 17333 Roy St
- 17246 Burnham Ave
- 17303 Roy St
- 17222 Roy St
- 17242 Community St
- 3133 Bernice Rd Unit 2
- 3127 Bernice Rd Unit 5
- 3101 Bernice Rd Unit 31014
- 17226 Community St
- 17335 Community St
- 17332 Lorenz Ave
- 17153 Walter St
- 3069 Bernice Rd
- 3061 Bernice Rd
- 17132 Walter St
- 3045 Bernice Rd
- 17524 Walter St
- 17322 Walter St
- 17326 Walter St
- 17312 Walter St
- 17323 Burnham Ave
- 17319 Burnham Ave
- 17327 Burnham Ave
- 17327 Burnham Ave
- 17306 Walter St
- 17336 Walter St
- 17331 Burnham Ave
- 17315 Burnham Ave
- 17323 Walter St
- 17319 Walter St
- 17327 Walter St
- 17339 Burnham Ave
- 17340 Walter St
- 17302 Walter St
- 17307 Burnham Ave
- 17307 Burnham Ave
- 17313 Walter St
Ask me questions while you tour the home.