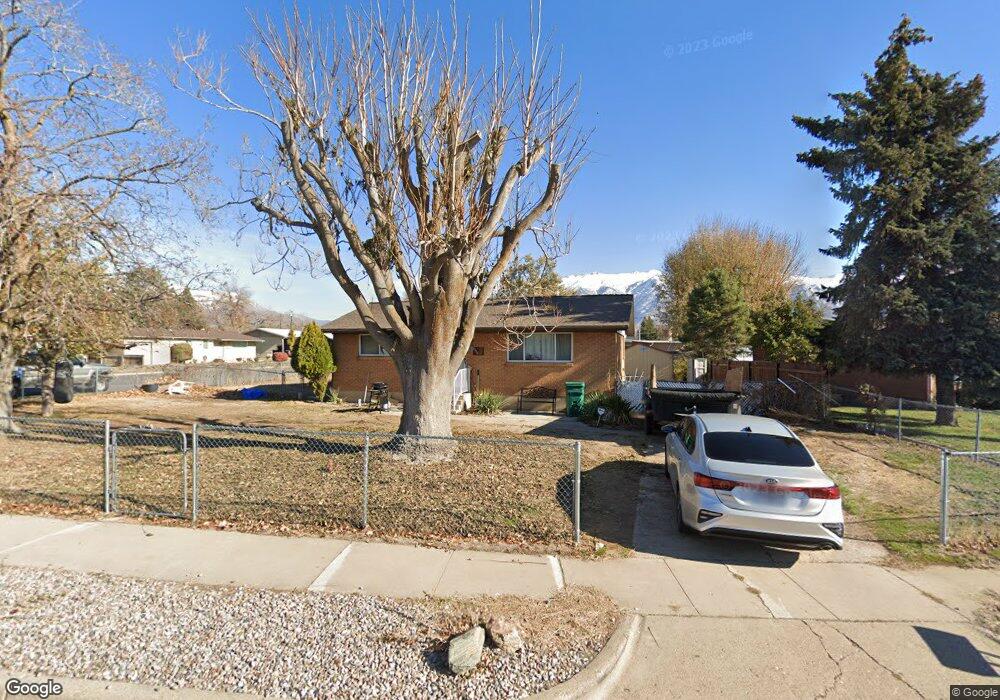
1734 Bennett St Layton, UT 84041
Estimated Value: $342,000 - $380,000
2
Beds
1
Bath
925
Sq Ft
$393/Sq Ft
Est. Value
About This Home
This home is located at 1734 Bennett St, Layton, UT 84041 and is currently estimated at $363,219, approximately $392 per square foot. 1734 Bennett St is a home located in Davis County with nearby schools including Lincoln Elementary School, North Layton Junior High School, and Northridge High School.
Ownership History
Date
Name
Owned For
Owner Type
Purchase Details
Closed on
Aug 10, 2022
Sold by
Malone Laura
Bought by
Malone Laura and Pacheco Dominick Amos
Current Estimated Value
Home Financials for this Owner
Home Financials are based on the most recent Mortgage that was taken out on this home.
Original Mortgage
$125,000
Outstanding Balance
$119,052
Interest Rate
5.7%
Mortgage Type
New Conventional
Estimated Equity
$244,167
Purchase Details
Closed on
Aug 8, 2022
Sold by
Lopez Laura L
Bought by
Malone Laura
Home Financials for this Owner
Home Financials are based on the most recent Mortgage that was taken out on this home.
Original Mortgage
$125,000
Outstanding Balance
$119,052
Interest Rate
5.7%
Mortgage Type
New Conventional
Estimated Equity
$244,167
Purchase Details
Closed on
Sep 28, 2004
Sold by
Pacheco Amos Thomas and Pacheco Gloria A
Bought by
Lopez Laura L and Pacheco Gloria A
Create a Home Valuation Report for This Property
The Home Valuation Report is an in-depth analysis detailing your home's value as well as a comparison with similar homes in the area
Home Values in the Area
Average Home Value in this Area
Purchase History
| Date | Buyer | Sale Price | Title Company |
|---|---|---|---|
| Malone Laura | -- | First American Title | |
| Malone Laura | -- | First American Title | |
| Lopez Laura L | -- | -- |
Source: Public Records
Mortgage History
| Date | Status | Borrower | Loan Amount |
|---|---|---|---|
| Open | Malone Laura | $125,000 |
Source: Public Records
Tax History
| Year | Tax Paid | Tax Assessment Tax Assessment Total Assessment is a certain percentage of the fair market value that is determined by local assessors to be the total taxable value of land and additions on the property. | Land | Improvement |
|---|---|---|---|---|
| 2025 | $1,661 | $174,350 | $97,133 | $77,217 |
| 2024 | $1,628 | $172,150 | $113,166 | $58,984 |
| 2023 | $1,577 | $294,000 | $134,416 | $159,584 |
| 2022 | $1,570 | $158,950 | $71,105 | $87,845 |
| 2021 | $1,464 | $221,000 | $99,836 | $121,164 |
| 2020 | $1,333 | $193,000 | $83,964 | $109,036 |
| 2019 | $142 | $192,000 | $79,710 | $112,290 |
| 2018 | $1,187 | $169,000 | $79,710 | $89,290 |
| 2016 | $1,040 | $76,396 | $25,493 | $50,903 |
| 2015 | $988 | $68,201 | $25,493 | $42,708 |
| 2014 | $900 | $64,178 | $25,493 | $38,685 |
| 2013 | -- | $69,020 | $24,816 | $44,204 |
Source: Public Records
Map
Nearby Homes
- 1715 N Alder St
- 538 W 1875 N
- 1683 N 250 W
- 247 W 1925 N
- 1571 N 160 W
- 1908 N 200 W
- 1857 N 50 W
- 2149 N 750 W
- 1500 N Angel St Unit 12
- 1500 N Angel St Unit 22
- 14 W Belvedere Way
- 506 W 2200 N
- 2211 N 525 W
- 2236 N 525 W
- 1148 N 350 W
- 2234 N 450 W
- 2246 N 475 W
- 2048 Evans Cove Loop
- 1094 N Angel St W
- 1617 N Angel St
- 602 W 1800 N
- 614 W 1800 N
- 1720 Bennett St
- 519 Paul Ave
- 617 W 1800 N
- 1733 Bennett St
- 1708 Bennett St
- 591 W 1800 N
- 570 Paul Ave
- 530 Paul Ave
- 590 Paul Ave
- 1729 Bennett St
- 1717 Bennett St
- 715 W 1800 N
- 705 W 1800 N
- 1739 N Alder St
- 1739 Alder St
- 1729 N Alder St Unit NE Bedroom
- 1729 N Alder St Unit SW Bedroom
- 1729 N Alder St Unit NW Bedroom
Your Personal Tour Guide
Ask me questions while you tour the home.