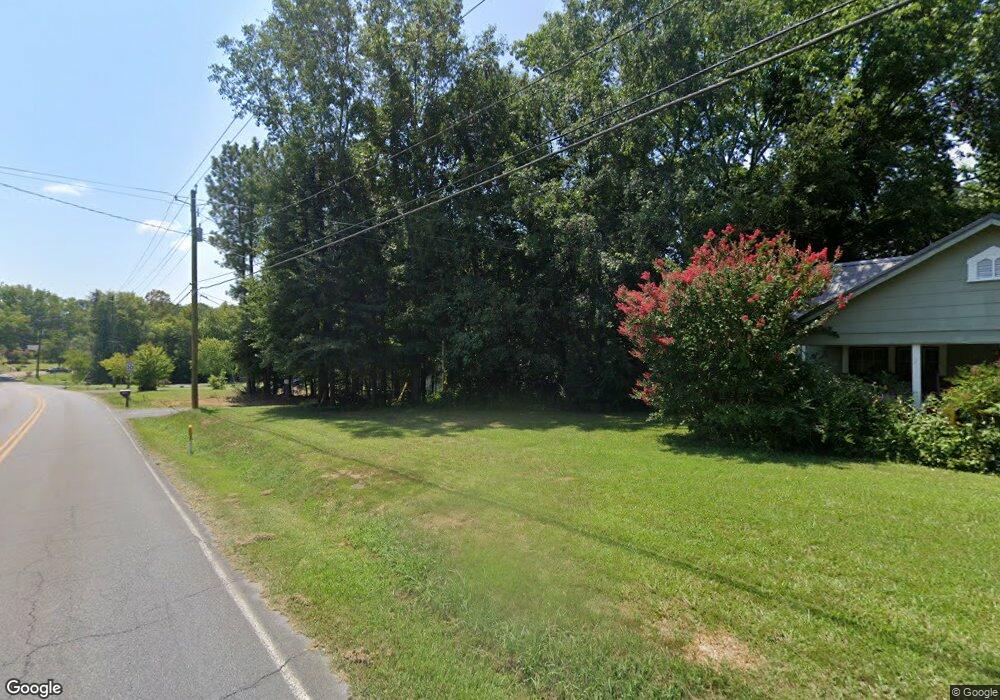
1734 Riverbend Rd Dalton, GA 30721
Estimated Value: $112,000 - $220,000
2
Beds
1
Bath
1,032
Sq Ft
$170/Sq Ft
Est. Value
About This Home
This home is located at 1734 Riverbend Rd, Dalton, GA 30721 and is currently estimated at $175,129, approximately $169 per square foot. 1734 Riverbend Rd is a home located in Whitfield County with nearby schools including Antioch Elementary School, Eastbrook Middle School, and Southeast Whitfield County High School.
Ownership History
Date
Name
Owned For
Owner Type
Purchase Details
Closed on
Nov 8, 2024
Sold by
C And C Southeastern Partners Llc
Bought by
Santizo Perez Jose Luis
Current Estimated Value
Purchase Details
Closed on
Jun 11, 2010
Sold by
Federal Home Loan Mortgage Corporation
Bought by
Skidmore Jerry
Purchase Details
Closed on
Aug 11, 2006
Sold by
Welch Jeffey L
Bought by
Rodriguez Maria E
Home Financials for this Owner
Home Financials are based on the most recent Mortgage that was taken out on this home.
Original Mortgage
$110,774
Interest Rate
6.67%
Mortgage Type
New Conventional
Purchase Details
Closed on
Mar 15, 2005
Sold by
Not Provided
Bought by
Skidmore Jerry
Home Financials for this Owner
Home Financials are based on the most recent Mortgage that was taken out on this home.
Original Mortgage
$104,263
Interest Rate
5.57%
Mortgage Type
FHA
Purchase Details
Closed on
Apr 1, 1999
Bought by
Jones David Anthony and Jones Kimberly
Create a Home Valuation Report for This Property
The Home Valuation Report is an in-depth analysis detailing your home's value as well as a comparison with similar homes in the area
Purchase History
| Date | Buyer | Sale Price | Title Company |
|---|---|---|---|
| Santizo Perez Jose Luis | $200,000 | None Listed On Document | |
| Santizo Perez Jose Luis | $200,000 | None Listed On Document | |
| Skidmore Jerry | $35,000 | -- | |
| Rodriguez Maria E | $114,200 | -- | |
| Skidmore Jerry | $105,900 | -- | |
| Jones David Anthony | $74,600 | -- |
Source: Public Records
Mortgage History
| Date | Status | Borrower | Loan Amount |
|---|---|---|---|
| Previous Owner | Rodriguez Maria E | $110,774 | |
| Previous Owner | Skidmore Jerry | $104,263 |
Source: Public Records
Tax History
| Year | Tax Paid | Tax Assessment Tax Assessment Total Assessment is a certain percentage of the fair market value that is determined by local assessors to be the total taxable value of land and additions on the property. | Land | Improvement |
|---|---|---|---|---|
| 2025 | $1,638 | $66,810 | $14,650 | $52,160 |
| 2024 | $1,638 | $66,810 | $14,650 | $52,160 |
| 2023 | $1,203 | $38,508 | $5,348 | $33,160 |
| 2022 | $863 | $29,269 | $5,348 | $23,921 |
| 2021 | $864 | $29,269 | $5,348 | $23,921 |
| 2020 | $893 | $29,269 | $5,348 | $23,921 |
| 2019 | $908 | $29,269 | $5,348 | $23,921 |
| 2018 | $912 | $28,961 | $5,040 | $23,921 |
| 2017 | $913 | $28,961 | $5,040 | $23,921 |
| 2016 | $820 | $27,060 | $5,040 | $22,020 |
| 2014 | $722 | $26,809 | $4,790 | $22,020 |
| 2013 | -- | $26,809 | $4,789 | $22,019 |
Source: Public Records
Map
Nearby Homes
- lot 5 Wendell St
- lot 6 Wendell St
- lot 7 Wendell St
- 1712 Wendell St
- 945 Riverbend Rd
- 1401 Eastbrook Dr SE
- 115 Zell Dr
- 00 Hill Rd
- 434 Liberty Dr
- 0 Ridge Rd SE Unit 1528911
- 171 Bear Den Ct
- 1629 Roosevelt Dr
- 121 Eugenia Dr
- 119 Eugenia Dr
- 1302 Jackson Rd
- 191 Hanks Bend
- 129 Hillwood Dr
- trac 3 Roosevelt Dr
- 118 Hill Rd
- 1142 Ben Hill Rd SE
- 1728 Riverbend Rd
- 1736 Riverbend Rd
- 1730 Riverbend Rd
- 1810 Nelson Dr
- 1312 Riverbend Rd
- 1814 Nelson Dr
- 1809 Nelson Dr
- 1732 Riverbend Rd
- 1724 Riverbend Rd
- 1802 Riverbend Rd
- 1725 Riverbend Rd
- 1813 Nelson Dr
- 1828 Nelson Dr
- 1777 Riverbend Rd
- 1806 Riverbend Rd
- 1805 Riverbend Rd
- 146 Denmark Way
- 146 Vera Way
- 1721 Riverbend Rd
- 1718 Riverbend Rd
Your Personal Tour Guide
Ask me questions while you tour the home.