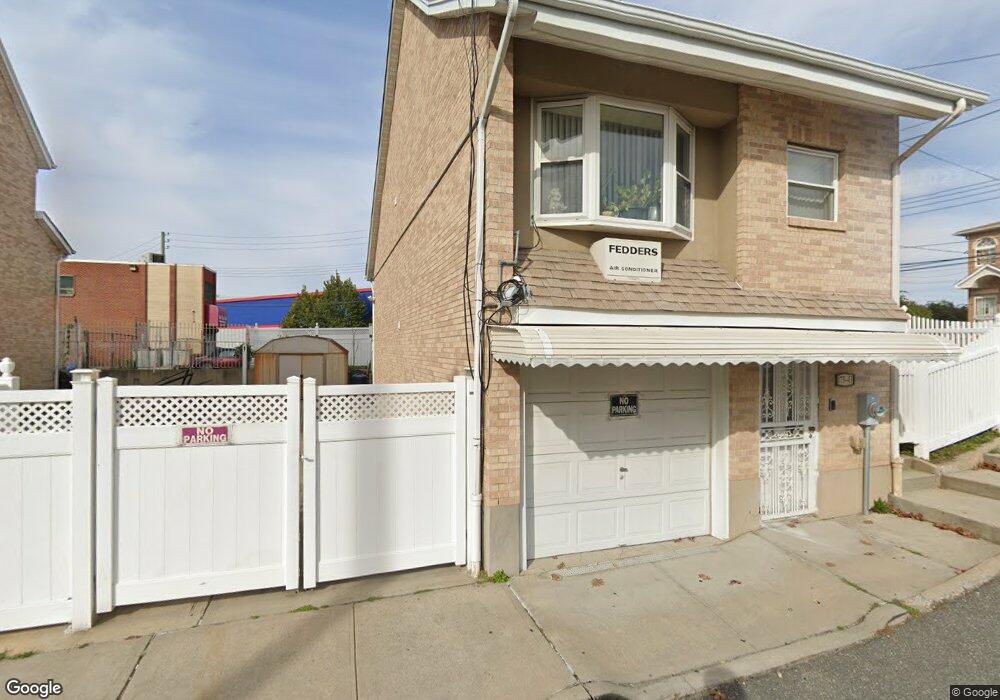
17343 Vaswani Ave Jamaica, NY 11434
Saint Albans NeighborhoodEstimated Value: $887,918 - $964,000
--
Bed
--
Bath
1,542
Sq Ft
$593/Sq Ft
Est. Value
About This Home
This home is located at 17343 Vaswani Ave, Jamaica, NY 11434 and is currently estimated at $914,230, approximately $592 per square foot. 17343 Vaswani Ave is a home located in Queens County with nearby schools including The Jermaine L. Green STEM Institute of Queens and Catherine & Count Basie Middle School 72.
Ownership History
Date
Name
Owned For
Owner Type
Purchase Details
Closed on
Aug 10, 2006
Sold by
Merrill Avenue Llc
Bought by
Merrill Street Llc
Current Estimated Value
Home Financials for this Owner
Home Financials are based on the most recent Mortgage that was taken out on this home.
Original Mortgage
$97,800
Outstanding Balance
$58,941
Interest Rate
6.83%
Estimated Equity
$855,289
Purchase Details
Closed on
Sep 21, 2005
Sold by
Millenium Homes Llc
Bought by
Merrill Avenue Llc
Purchase Details
Closed on
Mar 26, 2002
Sold by
The City Of New York
Bought by
Millennium Homes Llc
Home Financials for this Owner
Home Financials are based on the most recent Mortgage that was taken out on this home.
Original Mortgage
$393,250
Interest Rate
6.16%
Create a Home Valuation Report for This Property
The Home Valuation Report is an in-depth analysis detailing your home's value as well as a comparison with similar homes in the area
Home Values in the Area
Average Home Value in this Area
Purchase History
| Date | Buyer | Sale Price | Title Company |
|---|---|---|---|
| Merrill Street Llc | $2,600,000 | -- | |
| Assanah Peggy | $489,000 | -- | |
| Merrill Street Llc | $2,600,000 | -- | |
| Assanah Peggy | $489,000 | -- | |
| Merrill Avenue Llc | -- | -- | |
| Merrill Avenue Llc | -- | -- | |
| Millennium Homes Llc | -- | -- | |
| Millennium Homes Llc | -- | -- |
Source: Public Records
Mortgage History
| Date | Status | Borrower | Loan Amount |
|---|---|---|---|
| Open | Assanah Peggy | $97,800 | |
| Closed | Assanah Peggy | $97,800 | |
| Previous Owner | Assanah Peggy | $391,200 | |
| Previous Owner | Millennium Homes Llc | $393,250 | |
| Closed | Merrill Avenue Llc | $0 |
Source: Public Records
Tax History Compared to Growth
Tax History
| Year | Tax Paid | Tax Assessment Tax Assessment Total Assessment is a certain percentage of the fair market value that is determined by local assessors to be the total taxable value of land and additions on the property. | Land | Improvement |
|---|---|---|---|---|
| 2025 | $8,516 | $43,373 | $13,546 | $29,827 |
| 2024 | $8,516 | $42,402 | $15,848 | $26,554 |
| 2023 | $8,035 | $40,003 | $14,915 | $25,088 |
| 2022 | $7,560 | $40,860 | $18,120 | $22,740 |
| 2021 | $7,607 | $41,640 | $18,120 | $23,520 |
| 2020 | $7,355 | $45,780 | $18,120 | $27,660 |
| 2019 | $7,099 | $39,180 | $18,120 | $21,060 |
| 2018 | $6,498 | $33,336 | $15,657 | $17,679 |
| 2017 | $6,134 | $31,560 | $18,120 | $13,440 |
| 2016 | $5,711 | $31,560 | $18,120 | $13,440 |
| 2015 | $2,551 | $31,212 | $17,775 | $13,437 |
| 2014 | $2,551 | $29,446 | $20,028 | $9,418 |
Source: Public Records
Map
Nearby Homes
- 173-33 Vaswani Ave
- 172-40 125th Ave
- 172-44 126th Ave
- 174-41 125th Ave
- 55 128th Ave
- 174-63 128th Ave
- 174-17 129th Ave
- 172-21 Baisley Blvd
- 125-11 172nd St
- 172-38 Brocher Rd
- 12126 Irwin Place
- 17710 Troutville Rd
- 17715 Troutville Rd
- 176-27 Sunbury Rd
- 119-73 Merrill St
- 17204 Amelia Rd
- 17720 Leslie Rd
- 12030 172nd St
- 176-15 130th Ave
- 178-20 Selover Rd
- 173-39 124th Ave
- 173-39 Vaswani Ave
- 173-37 Vaswani Ave
- 173-35 Vaswani Ave
- 17417 125th Ave
- 17415 125th Ave
- 12405 Merrill St
- 17441 125th Ave Unit 100
- 17441 125th Ave
- 173-31 Vaswani Ave
- 17417 125th Ave
- 17411 125th Ave
- 17427 125th Ave
- 17409 125th Ave
- 173-29 Vaswani Ave
- 12220 Merrill St
- 17405 125th Ave
- 17431 125th Ave
- 17431 125th Ave
- 12222 Merrick Blvd