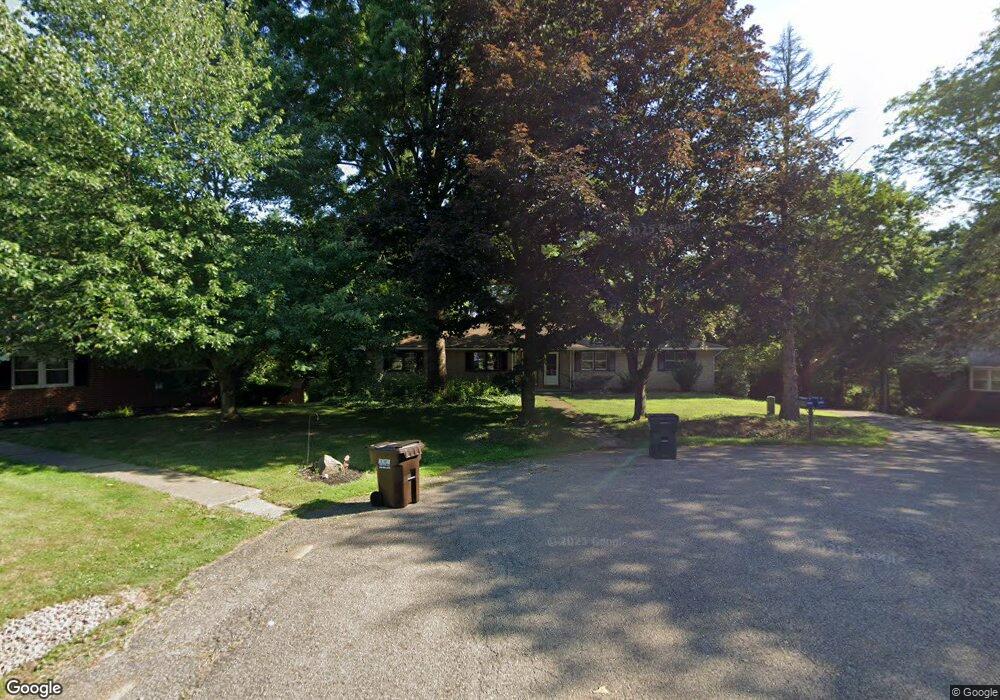
1735 Bunyan Cir NW Massillon, OH 44646
Amherst Heights-Clearview NeighborhoodEstimated Value: $216,000 - $259,000
4
Beds
4
Baths
2,088
Sq Ft
$117/Sq Ft
Est. Value
About This Home
This home is located at 1735 Bunyan Cir NW, Massillon, OH 44646 and is currently estimated at $243,295, approximately $116 per square foot. 1735 Bunyan Cir NW is a home located in Stark County with nearby schools including Pfeiffer Intermediate School, Edison Middle School, and Perry High School.
Ownership History
Date
Name
Owned For
Owner Type
Purchase Details
Closed on
Sep 21, 2022
Sold by
Torbett Morgen C
Bought by
Torbett Morgen C and Schmiesing Travis R
Current Estimated Value
Purchase Details
Closed on
Jun 25, 2004
Sold by
Torbett Peter
Bought by
Torbett Peter and Torbett Morgen C
Purchase Details
Closed on
Apr 26, 2002
Sold by
Destefano Lieselotte
Bought by
Destefano Lieselotte and Torbett Peter
Create a Home Valuation Report for This Property
The Home Valuation Report is an in-depth analysis detailing your home's value as well as a comparison with similar homes in the area
Home Values in the Area
Average Home Value in this Area
Purchase History
| Date | Buyer | Sale Price | Title Company |
|---|---|---|---|
| Torbett Morgen C | -- | -- | |
| Torbett Peter | -- | -- | |
| Destefano Lieselotte | -- | -- |
Source: Public Records
Tax History Compared to Growth
Tax History
| Year | Tax Paid | Tax Assessment Tax Assessment Total Assessment is a certain percentage of the fair market value that is determined by local assessors to be the total taxable value of land and additions on the property. | Land | Improvement |
|---|---|---|---|---|
| 2025 | -- | $61,530 | $20,510 | $41,020 |
| 2024 | -- | $61,530 | $20,510 | $41,020 |
| 2023 | $3,098 | $60,450 | $17,680 | $42,770 |
| 2022 | $3,070 | $60,450 | $17,680 | $42,770 |
| 2021 | $3,268 | $60,450 | $17,680 | $42,770 |
| 2020 | $2,819 | $50,020 | $14,880 | $35,140 |
| 2019 | $2,540 | $50,020 | $14,880 | $35,140 |
| 2018 | $2,516 | $50,020 | $14,880 | $35,140 |
| 2017 | $2,392 | $44,040 | $12,080 | $31,960 |
| 2016 | $2,405 | $44,040 | $12,080 | $31,960 |
| 2015 | $2,426 | $44,040 | $12,080 | $31,960 |
| 2014 | $290 | $40,920 | $11,240 | $29,680 |
| 2013 | $1,092 | $40,920 | $11,240 | $29,680 |
Source: Public Records
Map
Nearby Homes
- 2406 Nottingham St NW
- 2554 Mary Lou St NW
- 7770 Hills And Dales Rd NW
- 1715 Jackson Ave NW
- 000 Jackson Ave NW
- 2919 Inwood Dr NW
- 0 Wildridge Rd NW Unit 36853475
- 1545 Clearbrook Rd NW
- 2984 Villa Glen Cir NW
- 2174 Via Luna Cir NE Unit 15
- 2172 Via Luna Cir NE Unit 16
- 1312 Lennox Ave NE
- 3176 Carie Hill Cir NW
- 1717 Chittenden Cir NE
- 1001 27th St NE
- 2873 Olympia Dr NW
- VL Mill Creek Run NE
- 3051 Blue Ash Ave NW
- 937 27th St NE
- Lot 38 Joyce Ave NW
- 1740 Bunyan Cir NW
- 1741 Bunyan Cir NW
- 1747 Bunyan Cir NW
- 1750 Bunyan Cir NW
- 2230 Carlyle St NW
- 2216 Carlyle St NW
- 2241 Tennyson St NW
- 2240 Carlyle St NW
- 2165 Tennyson St NW
- 1715 Montaque Ave NW
- 1727 Montaque Ave NW
- 2150 Carlyle St NW
- 1737 Montaque Ave NW
- 2224 Tennyson St NW
- 1707 Montaque Ave NW
- 1812 Thackeray Ave NW
- 1815 Kipling Ave NW
- 2235 Carlyle St NW
- 2149 Tennyson St NW
- 100 Crusader St