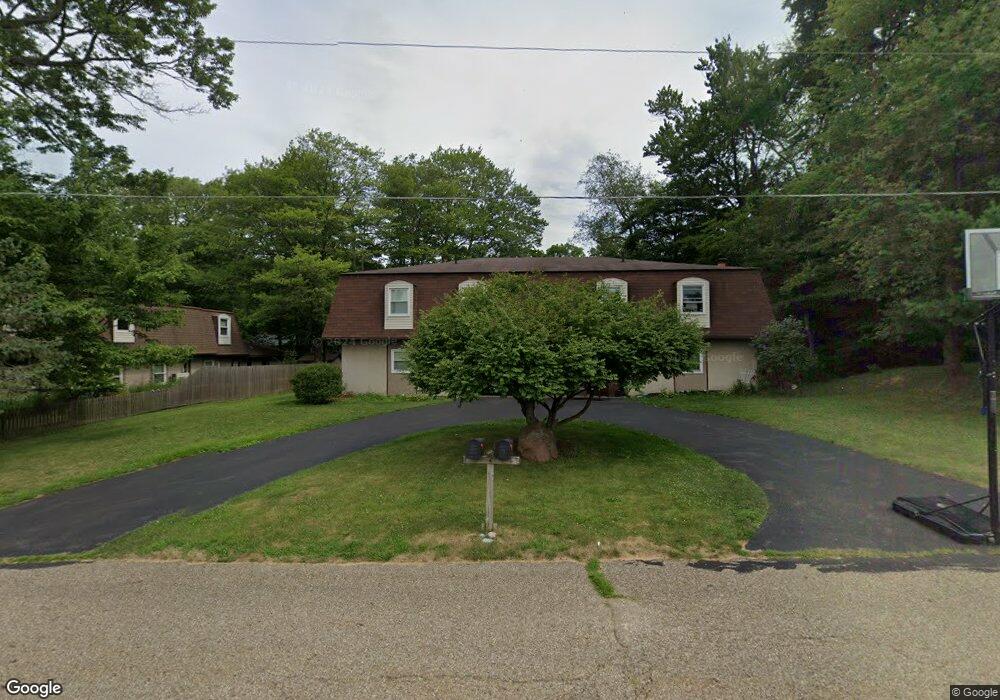
1735 High St Louisville, OH 44641
Estimated Value: $240,617 - $283,000
6
Beds
4
Baths
3,456
Sq Ft
$77/Sq Ft
Est. Value
About This Home
This home is located at 1735 High St, Louisville, OH 44641 and is currently estimated at $267,404, approximately $77 per square foot. 1735 High St is a home located in Stark County with nearby schools including Louisville High School and St. Thomas Aquinas High School & Middle School.
Ownership History
Date
Name
Owned For
Owner Type
Purchase Details
Closed on
May 25, 2018
Sold by
Goodnite Jack H and Goodnite Judith A
Bought by
Diepenbrock Raymond J
Current Estimated Value
Home Financials for this Owner
Home Financials are based on the most recent Mortgage that was taken out on this home.
Original Mortgage
$173,000
Outstanding Balance
$148,959
Interest Rate
4.4%
Mortgage Type
VA
Estimated Equity
$118,445
Purchase Details
Closed on
Oct 16, 1991
Create a Home Valuation Report for This Property
The Home Valuation Report is an in-depth analysis detailing your home's value as well as a comparison with similar homes in the area
Home Values in the Area
Average Home Value in this Area
Purchase History
| Date | Buyer | Sale Price | Title Company |
|---|---|---|---|
| Diepenbrock Raymond J | $173,000 | None Available | |
| -- | $75,000 | -- |
Source: Public Records
Mortgage History
| Date | Status | Borrower | Loan Amount |
|---|---|---|---|
| Open | Diepenbrock Raymond J | $173,000 |
Source: Public Records
Tax History Compared to Growth
Tax History
| Year | Tax Paid | Tax Assessment Tax Assessment Total Assessment is a certain percentage of the fair market value that is determined by local assessors to be the total taxable value of land and additions on the property. | Land | Improvement |
|---|---|---|---|---|
| 2025 | -- | $68,430 | $16,700 | $51,730 |
| 2024 | -- | $68,430 | $16,700 | $51,730 |
| 2023 | $2,831 | $64,330 | $15,750 | $48,580 |
| 2022 | $1,419 | $64,330 | $15,750 | $48,580 |
| 2021 | $2,845 | $64,330 | $15,750 | $48,580 |
| 2020 | $2,408 | $58,940 | $14,210 | $44,730 |
| 2019 | $2,414 | $59,610 | $14,210 | $45,400 |
| 2018 | $2,438 | $59,610 | $14,210 | $45,400 |
| 2017 | $2,399 | $56,600 | $12,500 | $44,100 |
| 2016 | $2,448 | $56,600 | $12,500 | $44,100 |
| 2015 | $2,455 | $56,600 | $12,500 | $44,100 |
| 2014 | $282 | $48,900 | $10,780 | $38,120 |
| 2013 | $1,145 | $48,900 | $10,780 | $38,120 |
Source: Public Records
Map
Nearby Homes
- 1715 High St
- 1812 E Broad St
- 641 S Nickelplate St
- 308 Superior St
- 2110 Edmar St
- 2015 E Main St
- 0 Michigan Blvd
- 520 S Silver St
- 728 E Broad St
- 204 E Broad St
- 510 S Bauman Ct
- 325 Lincoln Ave
- 908 Sand Lot Cir
- 107 E Broad St
- 1170 Winding Ridge Ave
- 3390 Meese Rd NE
- 910 Crosswyck Cir
- 1702 View Pointe Ave
- 428 Honeycrisp Dr NE
- 3047 Mcintosh Dr NE