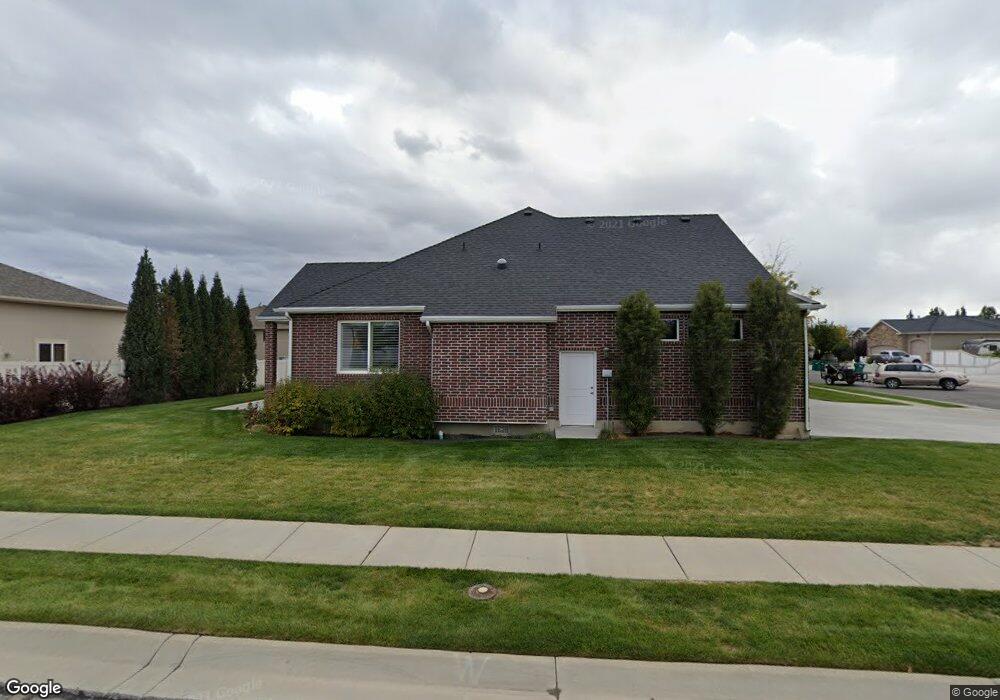
1736 S 2550 W West Haven, UT 84401
Estimated Value: $601,968 - $763,000
3
Beds
2
Baths
2,685
Sq Ft
$243/Sq Ft
Est. Value
About This Home
This home is located at 1736 S 2550 W, West Haven, UT 84401 and is currently estimated at $651,992, approximately $242 per square foot. 1736 S 2550 W is a home with nearby schools including West Weber School, Wahlquist Junior High School, and Fremont High School.
Ownership History
Date
Name
Owned For
Owner Type
Purchase Details
Closed on
Aug 11, 2016
Sold by
Taylor Ann W
Bought by
Taylor Ann W
Current Estimated Value
Purchase Details
Closed on
Mar 14, 2012
Sold by
Koz Construction Inc
Bought by
Taylor Ann W
Purchase Details
Closed on
Jun 15, 2011
Sold by
Neufeld Richard Alan
Bought by
Taylor Ann W
Purchase Details
Closed on
Jun 14, 2011
Sold by
Neufeld Milton D
Bought by
Taylor Ann W
Purchase Details
Closed on
Jul 10, 2008
Sold by
Mark Higley Inc
Bought by
Neufeld Richard Alan and Neufeld Milton D
Purchase Details
Closed on
Aug 7, 2006
Sold by
Northern Developers Llc
Bought by
Mark Higley Inc
Create a Home Valuation Report for This Property
The Home Valuation Report is an in-depth analysis detailing your home's value as well as a comparison with similar homes in the area
Home Values in the Area
Average Home Value in this Area
Purchase History
| Date | Buyer | Sale Price | Title Company |
|---|---|---|---|
| Taylor Ann W | -- | None Available | |
| Taylor Ann W | -- | Mountain View Title | |
| Taylor Ann W | -- | Lincoln Title Ins Agency | |
| Taylor Ann W | -- | Lincoln Title Ins Agency | |
| Neufeld Richard Alan | -- | Security Title Of Davis Coun | |
| Mark Higley Inc | -- | Security Title |
Source: Public Records
Tax History Compared to Growth
Tax History
| Year | Tax Paid | Tax Assessment Tax Assessment Total Assessment is a certain percentage of the fair market value that is determined by local assessors to be the total taxable value of land and additions on the property. | Land | Improvement |
|---|---|---|---|---|
| 2025 | $3,645 | $604,476 | $174,941 | $429,535 |
| 2024 | $3,487 | $326,699 | $96,217 | $230,482 |
| 2023 | $3,372 | $315,700 | $96,250 | $219,450 |
| 2022 | $3,177 | $304,150 | $96,250 | $207,900 |
| 2021 | $2,795 | $450,000 | $94,951 | $355,049 |
| 2020 | $2,629 | $387,000 | $79,988 | $307,012 |
| 2019 | $2,713 | $379,000 | $80,048 | $298,952 |
| 2018 | $2,810 | $377,000 | $65,963 | $311,037 |
| 2017 | $2,879 | $377,000 | $65,988 | $311,012 |
| 2016 | $2,919 | $207,338 | $36,336 | $171,002 |
| 2015 | $2,934 | $207,338 | $36,336 | $171,002 |
| 2014 | $2,709 | $186,338 | $36,336 | $150,002 |
Source: Public Records
Map
Nearby Homes
- 2504 W 1725 S
- 2454 W 1775 S
- 2611 W 1850 S
- 1882 S 2475 W
- 2300 Farmhouse Select Plan at Fairhaven
- 1856 S 2425 W
- 1918 S 2475 W
- 1903 S 2425 W
- 1977 S 2425 W
- 2067 S 2425 W
- 2050 Farmhouse Select Plan at Fairhaven
- 1953 S 2425 W
- 1869 S 2425 W
- 1944 S 2425 W
- 3000 Farmhouse Select Plan at Fairhaven
- 1656 S Prevedel Dr
- 1583 S Williams Dr
- 1694 S Hayfield Dr
- 2176 W 1735 S
- 2080 W 1755 Ct S
- 2519 W 1725 S
- 2519 W 1725 S Unit 38
- 2538 W 1775 S
- 1739 S 2550 W
- 1739 S 2550 W Unit 4
- 2524 W 1775 S
- 2533 W 1725 S Unit 87
- 2533 W 1725 S
- 2536 W 1725 S
- 1765 S 2550 W
- 1719 S 2550 W
- 1719 S 2550 W Unit 5
- 2522 W 1725 S
- 2510 W 1775 S
- 2505 W 1725 S
- 1696 S 2550 W
- 2523 W 1675 S
- 2539 W 1775 S
- 2496 W 1775 S
- 2525 W 1775 S