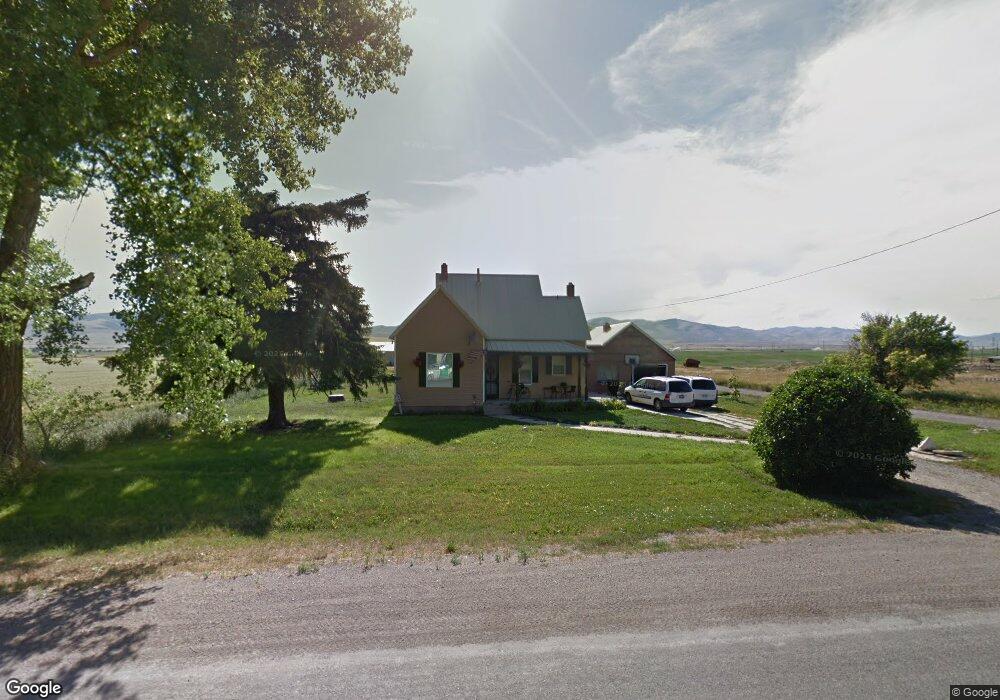
17365 N 4400 W Fielding, UT 84311
Estimated Value: $316,000 - $596,000
3
Beds
1
Bath
1,058
Sq Ft
$407/Sq Ft
Est. Value
About This Home
This home is located at 17365 N 4400 W, Fielding, UT 84311 and is currently estimated at $430,196, approximately $406 per square foot. 17365 N 4400 W is a home located in Box Elder County with nearby schools including Fielding School, Bear River Middle School, and Alice C. Harris Intermediate School.
Ownership History
Date
Name
Owned For
Owner Type
Purchase Details
Closed on
Sep 23, 2024
Sold by
Wintle Kayleen L
Bought by
Garn Abby L and Garn John H
Current Estimated Value
Home Financials for this Owner
Home Financials are based on the most recent Mortgage that was taken out on this home.
Original Mortgage
$237,500
Outstanding Balance
$234,830
Interest Rate
6.47%
Mortgage Type
New Conventional
Estimated Equity
$195,366
Purchase Details
Closed on
Apr 30, 2018
Sold by
Wintle Brent V and Wintle Kayleen L
Bought by
Wintle Kayleen L
Purchase Details
Closed on
Aug 11, 2006
Sold by
Godfrey Lynn and Godfrey Jessica
Bought by
Wintle Brent and Wintle Kayleen L
Home Financials for this Owner
Home Financials are based on the most recent Mortgage that was taken out on this home.
Original Mortgage
$79,800
Interest Rate
6.7%
Mortgage Type
New Conventional
Create a Home Valuation Report for This Property
The Home Valuation Report is an in-depth analysis detailing your home's value as well as a comparison with similar homes in the area
Home Values in the Area
Average Home Value in this Area
Purchase History
| Date | Buyer | Sale Price | Title Company |
|---|---|---|---|
| Garn Abby L | -- | Us Title | |
| Wintle Kayleen L | -- | Northern Title Company | |
| Wintle Brent | -- | None Available |
Source: Public Records
Mortgage History
| Date | Status | Borrower | Loan Amount |
|---|---|---|---|
| Open | Garn Abby L | $237,500 | |
| Previous Owner | Wintle Brent | $79,800 |
Source: Public Records
Tax History Compared to Growth
Tax History
| Year | Tax Paid | Tax Assessment Tax Assessment Total Assessment is a certain percentage of the fair market value that is determined by local assessors to be the total taxable value of land and additions on the property. | Land | Improvement |
|---|---|---|---|---|
| 2025 | $1,505 | $289,741 | $130,000 | $159,741 |
| 2024 | $1,315 | $286,936 | $130,000 | $156,936 |
| 2023 | $1,367 | $301,673 | $130,000 | $171,673 |
| 2022 | $1,222 | $139,642 | $35,750 | $103,892 |
| 2021 | $662 | $122,292 | $30,000 | $92,292 |
| 2020 | $684 | $122,292 | $30,000 | $92,292 |
| 2019 | $624 | $58,801 | $16,500 | $42,301 |
| 2018 | $605 | $53,283 | $16,500 | $36,783 |
| 2017 | $627 | $96,878 | $16,500 | $66,878 |
| 2016 | $602 | $51,531 | $16,500 | $35,031 |
| 2015 | $401 | $34,665 | $16,500 | $18,165 |
| 2014 | $401 | $33,800 | $16,500 | $17,300 |
| 2013 | -- | $32,227 | $16,500 | $15,727 |
Source: Public Records
Map
Nearby Homes
- 95 W 100 N
- 18100 N 4400 W
- 18120 N 4400 W
- 95 E 100 S
- 18250 N 4400 W
- 303 S Center St
- 16580 N 5200 W
- 15920 N 4000 W Unit 14
- 18068 N 6000 W
- 18188 N 6000 W
- Berrington Plan at Lookout Mountain
- Stanton Plan at Lookout Mountain
- Cambria Plan at Lookout Mountain
- Brantwood Plan at Lookout Mountain
- Hallwood Plan at Lookout Mountain
- Vanbrough Plan at Lookout Mountain
- Norfolk Plan at Lookout Mountain
- Xavier Plan at Lookout Mountain
- Foxhill Plan at Lookout Mountain
- Knighton Plan at Lookout Mountain
- 17350 N 4400 W
- 17370 N 4400 W
- 17525 N 4400 W
- 17300 N 4400 W
- 17505 N 4400 W
- 17515 N 4400 W
- 17215 N 4400 W
- 16940 N 4000 W
- 0 See Remarks Unit 606038
- 17640 N 5200 W
- 100 N 450 W
- 18065 N 5200 W
- 19200 N 3000 W
- 80 N Center St
- 18643 N 6000 W Unit 2
- 18500 N 6000 W Unit 1
- 16580 N 4400 W
- 0 See Remarks Unit 834428
- 0 See Remarks Unit 834421
- 40 W 200 S Unit 2