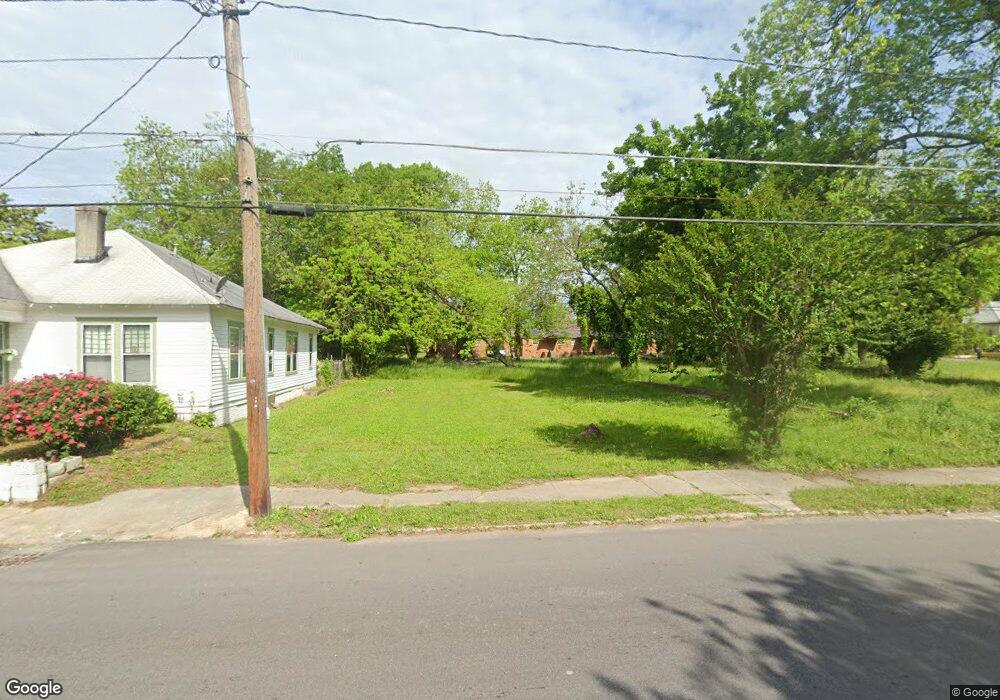
1737 2nd St Macon, GA 31201
Tindall Heights Historic District NeighborhoodEstimated Value: $12,000 - $101,000
Studio
2
Baths
2,115
Sq Ft
$24/Sq Ft
Est. Value
About This Home
This home is located at 1737 2nd St, Macon, GA 31201 and is currently estimated at $50,667, approximately $23 per square foot. 1737 2nd St is a home located in Bibb County with nearby schools including Ingram-Pye Elementary School, Central High School, and Cirrus Charter Academy.
Ownership History
Date
Name
Owned For
Owner Type
Purchase Details
Closed on
Sep 25, 2025
Sold by
Neighborhood Works Inc
Bought by
Macon-Bibb County Land Bank Authority
Current Estimated Value
Purchase Details
Closed on
Nov 11, 2019
Sold by
Macon Bibb County Land Bank Authority
Bought by
Neighborhood Workd Inc
Purchase Details
Closed on
May 24, 2017
Bought by
Macon Bibb County Land Bank Au
Purchase Details
Closed on
May 26, 2009
Sold by
The Macon Bibb County Land Bank Authorit
Bought by
The Housing Authority Of The City Of Mac
Purchase Details
Closed on
Sep 10, 2008
Sold by
Core Nbhd Revitalization Inc
Bought by
Macon-Bibb County Land Bank Auth Inc
Purchase Details
Closed on
Jul 20, 2005
Bought by
Core Nbhd Revitalization Inc
Create a Home Valuation Report for This Property
The Home Valuation Report is an in-depth analysis detailing your home's value as well as a comparison with similar homes in the area
Home Values in the Area
Average Home Value in this Area
Purchase History
| Date | Buyer | Sale Price | Title Company |
|---|---|---|---|
| Macon-Bibb County Land Bank Authority | $19,500 | None Listed On Document | |
| Neighborhood Workd Inc | $1,200 | None Available | |
| Macon Bibb County Land Bank Au | -- | -- | |
| The Housing Authority Of The City Of Mac | -- | None Available | |
| Macon-Bibb County Land Bank Auth Inc | $14,000 | -- | |
| The Macon Bibb County Land Bank Authorit | -- | None Available | |
| Core Nbhd Revitalization Inc | $40,000 | -- |
Source: Public Records
Tax History
| Year | Tax Paid | Tax Assessment Tax Assessment Total Assessment is a certain percentage of the fair market value that is determined by local assessors to be the total taxable value of land and additions on the property. | Land | Improvement |
|---|---|---|---|---|
| 2025 | $76 | $3,080 | $3,080 | $0 |
| 2024 | $85 | $3,360 | $3,360 | $0 |
| 2023 | $83 | $2,800 | $2,800 | $0 |
| 2022 | $89 | $2,558 | $2,558 | $0 |
| 2021 | $97 | $2,558 | $2,558 | $0 |
| 2020 | $99 | $2,558 | $2,558 | $0 |
| 2019 | $240 | $2,558 | $2,558 | $0 |
| 2018 | $240 | $2,558 | $2,558 | $0 |
| 2017 | $0 | $4,544 | $2,353 | $2,191 |
| 2016 | $0 | $8,196 | $2,353 | $5,842 |
| 2015 | -- | $8,196 | $2,353 | $5,842 |
| 2014 | -- | $8,196 | $2,353 | $5,842 |
Source: Public Records
Map
Nearby Homes
- 745 Pebble St
- 553 & 565 Edgewood Ave
- 553 Edgewood Ave
- 791 Liberty St
- 510 Edgewood Ave
- 727 S Williams St
- 1470 2nd St
- 1590 Telfair St
- 1405 2nd St
- 1425 3rd St
- 836 Plant St
- 1083 Elm St
- 854 Plant St
- 356 Stratton St
- 1471 Jackson St
- 871 Tenney Ave
- 1335 Jackson St
- 974 Tenney Ave
- 672 Bowden St
- 1278 Jackson St
Your Personal Tour Guide
Ask me questions while you tour the home.