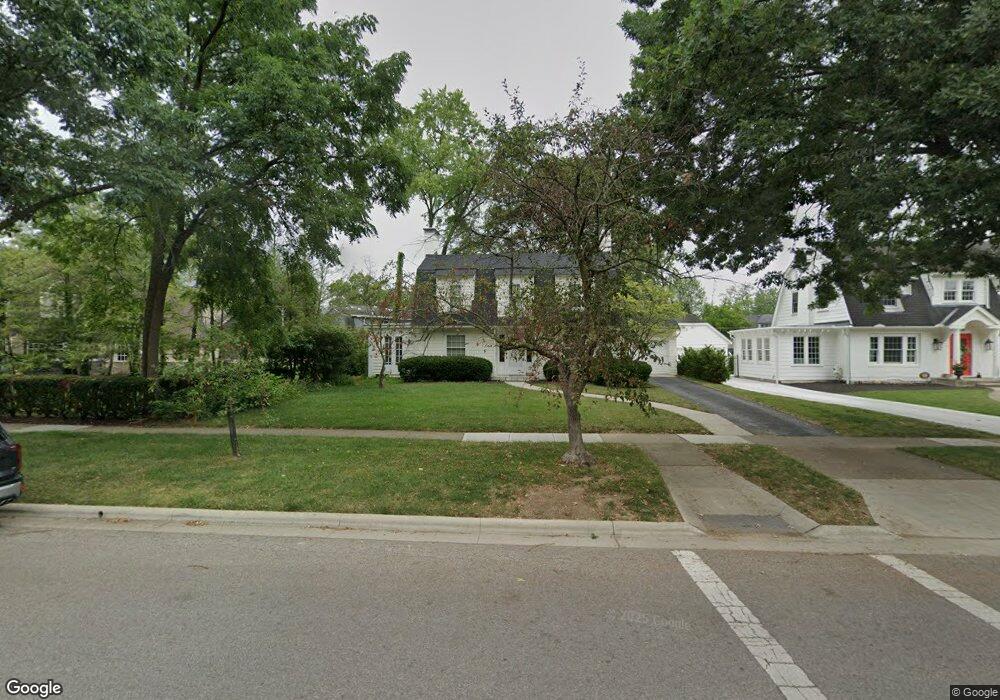
1737 Cambridge Blvd Columbus, OH 43212
Estimated Value: $670,000 - $976,000
4
Beds
3
Baths
1,879
Sq Ft
$436/Sq Ft
Est. Value
About This Home
This home is located at 1737 Cambridge Blvd, Columbus, OH 43212 and is currently estimated at $819,131, approximately $435 per square foot. 1737 Cambridge Blvd is a home located in Franklin County with nearby schools including Barrington Road Elementary School, Jones Middle School, and Upper Arlington High School.
Ownership History
Date
Name
Owned For
Owner Type
Purchase Details
Closed on
Jun 7, 2005
Sold by
Wilkinson Anne Hilaire and Bhangu Rajinder
Bought by
Bhangu Rajinder and Wilkinson Anne Hilaire
Current Estimated Value
Purchase Details
Closed on
Jan 27, 1999
Sold by
Auld Daniel L and Lembach Jennifer L
Bought by
Wilkinson Anne Hilaire
Home Financials for this Owner
Home Financials are based on the most recent Mortgage that was taken out on this home.
Original Mortgage
$235,200
Outstanding Balance
$56,005
Interest Rate
6.81%
Estimated Equity
$763,126
Purchase Details
Closed on
Oct 20, 1993
Bought by
Auld Daniel L
Purchase Details
Closed on
Jan 1, 1985
Create a Home Valuation Report for This Property
The Home Valuation Report is an in-depth analysis detailing your home's value as well as a comparison with similar homes in the area
Home Values in the Area
Average Home Value in this Area
Purchase History
| Date | Buyer | Sale Price | Title Company |
|---|---|---|---|
| Bhangu Rajinder | -- | Step 1 Titl | |
| Wilkinson Anne Hilaire | $294,000 | Chicago Title | |
| Auld Daniel L | $168,000 | -- | |
| -- | $92,000 | -- |
Source: Public Records
Mortgage History
| Date | Status | Borrower | Loan Amount |
|---|---|---|---|
| Open | Wilkinson Anne Hilaire | $235,200 |
Source: Public Records
Tax History Compared to Growth
Tax History
| Year | Tax Paid | Tax Assessment Tax Assessment Total Assessment is a certain percentage of the fair market value that is determined by local assessors to be the total taxable value of land and additions on the property. | Land | Improvement |
|---|---|---|---|---|
| 2024 | $15,311 | $264,470 | $119,110 | $145,360 |
| 2023 | $15,330 | $264,460 | $119,105 | $145,355 |
| 2022 | $14,609 | $209,060 | $72,770 | $136,290 |
| 2021 | $12,932 | $209,060 | $72,770 | $136,290 |
| 2020 | $12,817 | $209,060 | $72,770 | $136,290 |
| 2019 | $12,939 | $186,590 | $72,770 | $113,820 |
| 2018 | $12,342 | $186,590 | $72,770 | $113,820 |
| 2017 | $13,102 | $186,590 | $72,770 | $113,820 |
| 2016 | $11,654 | $172,280 | $68,010 | $104,270 |
| 2015 | $11,480 | $172,280 | $68,010 | $104,270 |
| 2014 | $11,394 | $172,280 | $68,010 | $104,270 |
| 2013 | $5,489 | $156,590 | $61,810 | $94,780 |
Source: Public Records
Map
Nearby Homes
- 2015 W 5th Ave Unit 211
- 2015 W 5th Ave Unit 102
- 2015 W 5th Ave Unit 108
- 1631 Roxbury Rd Unit F3
- 1631 Roxbury Rd Unit B6
- 1782 Wyandotte Rd
- 1561 Glenn Ave
- 1733 Elmwood Ave
- 1655-1657 Ashland Ave
- 1661 Ashland Ave Unit 663
- 1459 Elmwood Ave Unit 1459
- 1313 Lincoln Rd
- 2110 Northwest Blvd
- 1398 Lower Green Cir Unit 1398
- 1301 Lake Shore Dr Unit 199
- 1364 W 7th Ave
- 1869 Tewksbury Rd
- 1475 W 3rd Ave Unit 204
- 2063 Westover Rd
- 00 W 7th Ave
- 1745 Cambridge Blvd
- 1944 W Chelsea Rd
- 1725 Cambridge Blvd
- 1755 Cambridge Blvd
- 1956 W Chelsea Rd
- 1767 Cambridge Blvd
- 1740 Arlington Ave
- 1750 Arlington Ave
- 1910 King Ave
- 1730 Arlington Ave
- 1760 Arlington Ave
- 1760 Cambridge Blvd
- 1771 Cambridge Blvd
- 1941 W Chelsea Rd
- 1949 W Chelsea Rd
- 1933 W Chelsea Rd
- 1957 W Chelsea Rd
- 1925 W Chelsea Rd
- 1768 Arlington Ave
- 1710 Arlington Ave