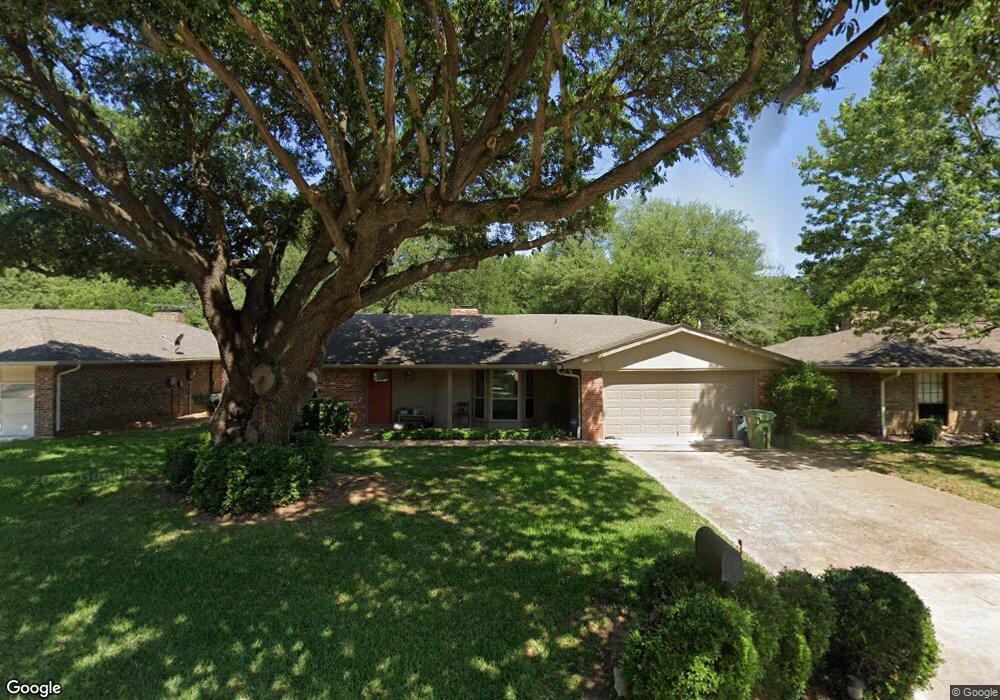
1737 Cimarron Trail Grapevine, TX 76051
Estimated Value: $393,011 - $438,000
3
Beds
2
Baths
1,378
Sq Ft
$301/Sq Ft
Est. Value
About This Home
This home is located at 1737 Cimarron Trail, Grapevine, TX 76051 and is currently estimated at $415,253, approximately $301 per square foot. 1737 Cimarron Trail is a home located in Tarrant County with nearby schools including Dove Elementary School, Grapevine Middle, and Grapevine High School.
Ownership History
Date
Name
Owned For
Owner Type
Purchase Details
Closed on
Jul 29, 2004
Sold by
Welton Christopher Scott
Bought by
Welton Patricia Lee Capps
Current Estimated Value
Purchase Details
Closed on
Apr 24, 1998
Sold by
Murdoch David L and Murdoch Barbara L
Bought by
Braden Donna L
Home Financials for this Owner
Home Financials are based on the most recent Mortgage that was taken out on this home.
Original Mortgage
$84,000
Outstanding Balance
$15,932
Interest Rate
7.09%
Estimated Equity
$399,321
Purchase Details
Closed on
Jan 26, 1995
Sold by
Gore Douglas W and Ryan Robyn M
Bought by
Murdoch David L and Murdoch Barbara L
Home Financials for this Owner
Home Financials are based on the most recent Mortgage that was taken out on this home.
Original Mortgage
$89,826
Interest Rate
9.2%
Mortgage Type
FHA
Create a Home Valuation Report for This Property
The Home Valuation Report is an in-depth analysis detailing your home's value as well as a comparison with similar homes in the area
Home Values in the Area
Average Home Value in this Area
Purchase History
| Date | Buyer | Sale Price | Title Company |
|---|---|---|---|
| Welton Patricia Lee Capps | -- | -- | |
| Braden Donna L | -- | Fidelity National Title | |
| Murdoch David L | -- | Commonwealth Land Title |
Source: Public Records
Mortgage History
| Date | Status | Borrower | Loan Amount |
|---|---|---|---|
| Open | Braden Donna L | $84,000 | |
| Previous Owner | Murdoch David L | $89,826 | |
| Closed | Welton Patricia Lee Capps | $0 |
Source: Public Records
Tax History Compared to Growth
Tax History
| Year | Tax Paid | Tax Assessment Tax Assessment Total Assessment is a certain percentage of the fair market value that is determined by local assessors to be the total taxable value of land and additions on the property. | Land | Improvement |
|---|---|---|---|---|
| 2025 | $4,019 | $335,500 | $82,500 | $253,000 |
| 2024 | $4,019 | $365,097 | $82,500 | $282,597 |
| 2023 | $5,227 | $338,187 | $77,000 | $261,187 |
| 2022 | $5,616 | $318,438 | $55,000 | $263,438 |
| 2021 | $5,603 | $257,686 | $55,000 | $202,686 |
| 2020 | $5,579 | $258,668 | $55,000 | $203,668 |
| 2019 | $5,259 | $265,380 | $60,000 | $205,380 |
| 2018 | $1,246 | $209,633 | $60,000 | $149,633 |
| 2017 | $4,407 | $222,536 | $60,000 | $162,536 |
| 2016 | $4,007 | $224,961 | $60,000 | $164,961 |
| 2015 | $3,310 | $157,500 | $30,000 | $127,500 |
| 2014 | $3,310 | $157,500 | $30,000 | $127,500 |
Source: Public Records
Map
Nearby Homes
- 2138 Sierra Dr
- 2211 Sierra Dr
- 1507 Cimarron Trail
- 2217 Pecos Dr
- 1650 Hyland Greens Dr
- 1092 Rosewood Dr
- 1985 Shorewood Dr
- 1723 Autumn Ridge Ln
- 1916 Everglade Ct
- 1902 Shorewood Dr
- 1641 Choteau Cir
- 2092 Holt Way
- 1827 Sonnet Dr
- 6007 Laurel Ln
- 6011 Laurel Ln
- 1654 Choteau Cir
- 831 Simmons Ct
- 1024 Woodbriar Dr
- 1626 Choteau Cir
- 2081 Holt Way
- 1731 Cimarron Trail
- 1743 Cimarron Trail
- 1725 Cimarron Trail
- 1749 Cimarron Trail
- 1732 Cimarron Trail
- 1738 Cimarron Trail
- 1726 Cimarron Trail
- 1744 Cimarron Trail
- 1755 Cimarron Trail
- 1719 Cimarron Trail
- 1720 Cimarron Trail
- 1750 Cimarron Trail
- 1731 Palo Duro Trail
- 1714 Cimarron Trail
- 1761 Cimarron Trail
- 1725 Palo Duro Trail
- 1737 Palo Duro Trail
- 1713 Cimarron Trail
- 1756 Cimarron Trail
- 1743 Palo Duro Trail