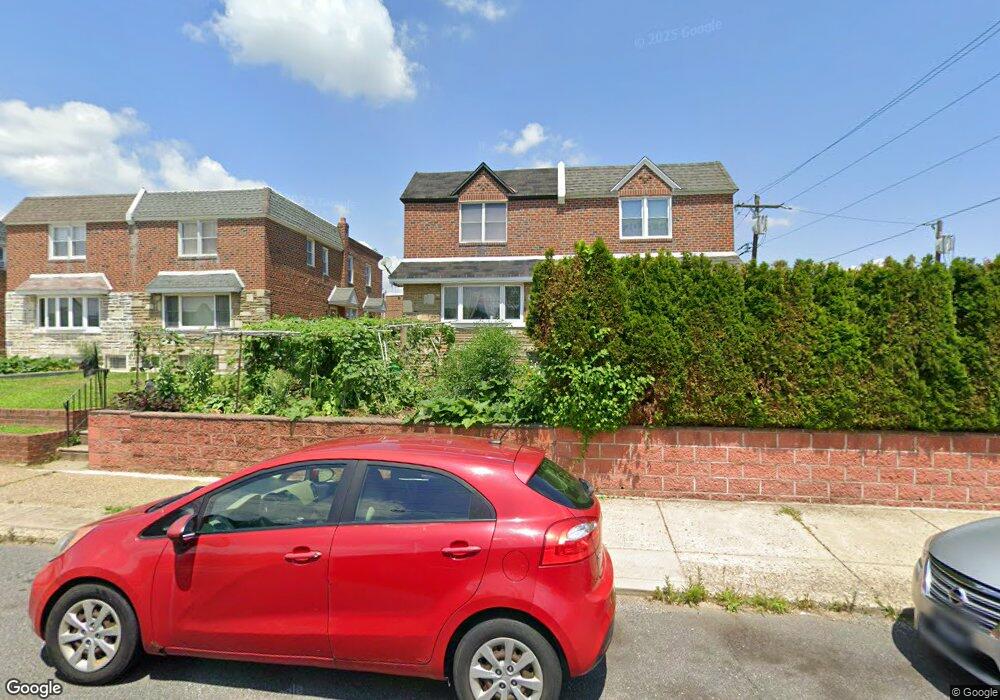
1737 Fox Chase Rd Philadelphia, PA 19152
Rhawnhurst NeighborhoodEstimated Value: $337,345 - $373,000
3
Beds
3
Baths
1,554
Sq Ft
$227/Sq Ft
Est. Value
About This Home
This home is located at 1737 Fox Chase Rd, Philadelphia, PA 19152 and is currently estimated at $353,336, approximately $227 per square foot. 1737 Fox Chase Rd is a home located in Philadelphia County with nearby schools including Farrell Louis H School, Northeast High School, and Tacony Academy Charter School.
Ownership History
Date
Name
Owned For
Owner Type
Purchase Details
Closed on
May 4, 2017
Sold by
Liang Ken and Liang Ying
Bought by
Liang Ying and Liang Edward
Current Estimated Value
Purchase Details
Closed on
Jul 12, 2012
Sold by
Hua Liang Ting Yi and Hua Lei Dao
Bought by
Liang Ken and Liang Ying
Purchase Details
Closed on
Mar 2, 2010
Sold by
Mangan Karen and Estate Of Kathleen Snyder
Bought by
Hua Liang Ting Yi and Hua Lei Dao
Home Financials for this Owner
Home Financials are based on the most recent Mortgage that was taken out on this home.
Original Mortgage
$152,000
Interest Rate
5%
Mortgage Type
New Conventional
Purchase Details
Closed on
Feb 9, 2001
Sold by
Apfelbaum Jodi
Bought by
Snyder Kathleen
Home Financials for this Owner
Home Financials are based on the most recent Mortgage that was taken out on this home.
Original Mortgage
$66,500
Interest Rate
7.08%
Purchase Details
Closed on
Aug 18, 1995
Sold by
Niederman Michael and Niederman Frances
Bought by
Apfelbaum Jodi
Create a Home Valuation Report for This Property
The Home Valuation Report is an in-depth analysis detailing your home's value as well as a comparison with similar homes in the area
Home Values in the Area
Average Home Value in this Area
Purchase History
| Date | Buyer | Sale Price | Title Company |
|---|---|---|---|
| Liang Ying | -- | None Available | |
| Liang Ken | -- | None Available | |
| Hua Liang Ting Yi | $200,000 | Stewart Title Guaranty Co | |
| Snyder Kathleen | $106,500 | Lawyers Title Insurance Co | |
| Apfelbaum Jodi | $92,000 | -- |
Source: Public Records
Mortgage History
| Date | Status | Borrower | Loan Amount |
|---|---|---|---|
| Previous Owner | Hua Liang Ting Yi | $152,000 | |
| Previous Owner | Snyder Kathleen | $66,500 |
Source: Public Records
Tax History Compared to Growth
Tax History
| Year | Tax Paid | Tax Assessment Tax Assessment Total Assessment is a certain percentage of the fair market value that is determined by local assessors to be the total taxable value of land and additions on the property. | Land | Improvement |
|---|---|---|---|---|
| 2025 | $3,595 | $317,100 | $63,420 | $253,680 |
| 2024 | $3,595 | $317,100 | $63,420 | $253,680 |
| 2023 | $3,595 | $256,800 | $51,360 | $205,440 |
| 2022 | $2,965 | $211,800 | $51,360 | $160,440 |
| 2021 | $2,952 | $0 | $0 | $0 |
| 2020 | $2,952 | $0 | $0 | $0 |
| 2019 | $2,688 | $0 | $0 | $0 |
| 2018 | $2,532 | $0 | $0 | $0 |
| 2017 | $2,532 | $0 | $0 | $0 |
| 2016 | $2,112 | $0 | $0 | $0 |
| 2015 | $2,022 | $0 | $0 | $0 |
| 2014 | -- | $180,900 | $44,868 | $136,032 |
| 2012 | -- | $23,552 | $3,826 | $19,726 |
Source: Public Records
Map
Nearby Homes
- 1711 Kendrick St
- 1700 Kendrick St
- 1716 Bergen St
- 1828 Megargee St
- 1712 Tustin St
- 1705 Solly Ave
- 8127 Langdon St
- 1832 Mower St
- 1702 Arthur St
- 1704 Stanwood St
- 8606 Frontenac St
- 8614 Agusta St
- 2155 Benson St
- 1625 Rhawn St
- 2162 Strahle St
- 1718 Rhawn St
- 8523 Benton Ave
- 8562 Benton Ave
- 1931 33 Rhawn St
- 2201 Strahle St Unit C302
- 1735 Fox Chase Rd
- 1739 Fox Chase Rd
- 1733 Fox Chase Rd
- 1731 Fox Chase Rd
- 1738 Arnold St
- 1736 Arnold St
- 1734 Arnold St
- 1729 Fox Chase Rd
- 1732 Arnold St
- 1730 Arnold St
- 1727 Fox Chase Rd
- 1803 Fox Chase Rd
- 1728 Arnold St
- 1732 Fox Chase Rd
- 1730 Fox Chase Rd
- 1725 Fox Chase Rd
- 1734 Fox Chase Rd
- 1726 Arnold St
- 1728 Fox Chase Rd
- 1805 Fox Chase Rd