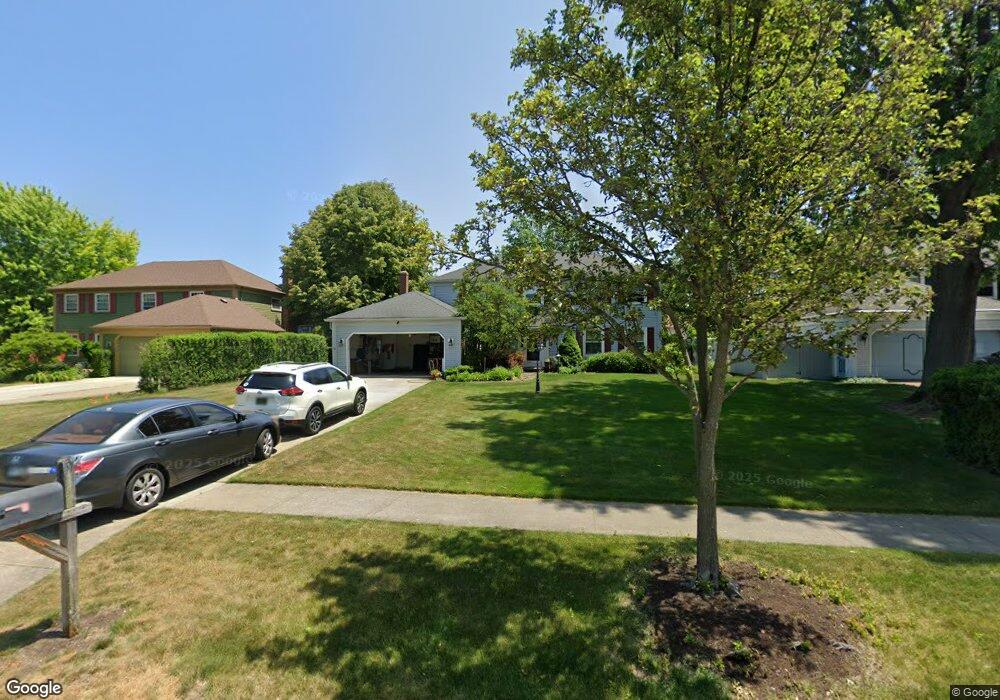
1737 Halls Carriage Path Westlake, OH 44145
Estimated Value: $409,000 - $490,000
4
Beds
2
Baths
2,376
Sq Ft
$189/Sq Ft
Est. Value
About This Home
This home is located at 1737 Halls Carriage Path, Westlake, OH 44145 and is currently estimated at $449,078, approximately $189 per square foot. 1737 Halls Carriage Path is a home located in Cuyahoga County with nearby schools including Dover Intermediate School, Lee Burneson Middle School, and Westlake High School.
Ownership History
Date
Name
Owned For
Owner Type
Purchase Details
Closed on
Sep 2, 2003
Sold by
Pigg William R and Pigg Kristen L
Bought by
Hoke Ferhat M and White Molly M
Current Estimated Value
Home Financials for this Owner
Home Financials are based on the most recent Mortgage that was taken out on this home.
Original Mortgage
$239,700
Interest Rate
5.02%
Mortgage Type
Purchase Money Mortgage
Purchase Details
Closed on
Mar 4, 1988
Sold by
Price Janet M
Bought by
Pigg William R
Purchase Details
Closed on
Sep 11, 1987
Sold by
Price Craig L
Bought by
Price Janet L
Purchase Details
Closed on
Aug 15, 1983
Sold by
Katsarides George
Bought by
Price Craig L
Purchase Details
Closed on
Jul 24, 1978
Bought by
Katsarides George
Purchase Details
Closed on
Jan 1, 1977
Bought by
Hennie Homes Inc
Create a Home Valuation Report for This Property
The Home Valuation Report is an in-depth analysis detailing your home's value as well as a comparison with similar homes in the area
Home Values in the Area
Average Home Value in this Area
Purchase History
| Date | Buyer | Sale Price | Title Company |
|---|---|---|---|
| Hoke Ferhat M | $282,000 | Midland Title Security Inc | |
| Pigg William R | $162,000 | -- | |
| Price Janet M | -- | -- | |
| Price Janet L | -- | -- | |
| Price Craig L | $106,000 | -- | |
| Katsarides George | $100,500 | -- | |
| Hennie Homes Inc | -- | -- |
Source: Public Records
Mortgage History
| Date | Status | Borrower | Loan Amount |
|---|---|---|---|
| Closed | Hoke Ferhat M | $239,700 |
Source: Public Records
Tax History Compared to Growth
Tax History
| Year | Tax Paid | Tax Assessment Tax Assessment Total Assessment is a certain percentage of the fair market value that is determined by local assessors to be the total taxable value of land and additions on the property. | Land | Improvement |
|---|---|---|---|---|
| 2024 | $6,136 | $129,535 | $32,795 | $96,740 |
| 2023 | $5,426 | $97,930 | $26,040 | $71,890 |
| 2022 | $5,340 | $97,930 | $26,040 | $71,890 |
| 2021 | $5,346 | $97,930 | $26,040 | $71,890 |
| 2020 | $5,397 | $90,690 | $24,120 | $66,570 |
| 2019 | $5,233 | $259,100 | $68,900 | $190,200 |
| 2018 | $5,349 | $90,690 | $24,120 | $66,570 |
| 2017 | $5,500 | $89,250 | $23,870 | $65,380 |
| 2016 | $5,471 | $89,250 | $23,870 | $65,380 |
| 2015 | $5,067 | $89,250 | $23,870 | $65,380 |
| 2014 | $5,067 | $81,140 | $21,320 | $59,820 |
Source: Public Records
Map
Nearby Homes
- 28167 Zinfandel Ct
- 1721 Merlot Ln
- Bowman Plan at Hope Pointe Place
- Ashton Plan at Hope Pointe Place
- 28200 Detroit Rd Unit D3
- 28140 Detroit Rd Unit D3
- 27923 Hilliard Blvd
- 1900 Sperrys Forge Trail
- 28323 Farrs Garden Path
- 28744 Woodmill Dr
- 0 Hilliard Blvd Unit 5150693
- 0 Hilliard Blvd Unit 5128276
- 29379 Detroit Rd
- 29363 Detroit Rd Unit 5
- 29331 Graystone Dr
- 1476 Bobby Ln Unit 7
- 27841 Birchwood Ct
- 879 S Parkside Dr
- 1455 Mozart Dr
- 841 S Parkside Dr
- 1745 Halls Carriage Path
- 1729 Halls Carriage Path
- 1753 Halls Carriage Path
- 1742 Taylors Mill Turn
- 1761 Halls Carriage Path
- 1750 Taylors Mill Turn
- 1744 Halls Carriage Path
- 1736 Halls Carriage Path
- 1752 Halls Carriage Path
- 1758 Taylors Mill Turn
- 1720 Halls Carriage Path
- 1769 Halls Carriage Path
- 1728 Halls Carriage Path
- 1766 Taylors Mill Turn
- 1777 Halls Carriage Path
- 1723 Coes Post Run
- 1774 Taylors Mill Turn
- 1739 Coes Post Run
- 1743 Taylors Mill Turn
- 1731 Coes Post Run