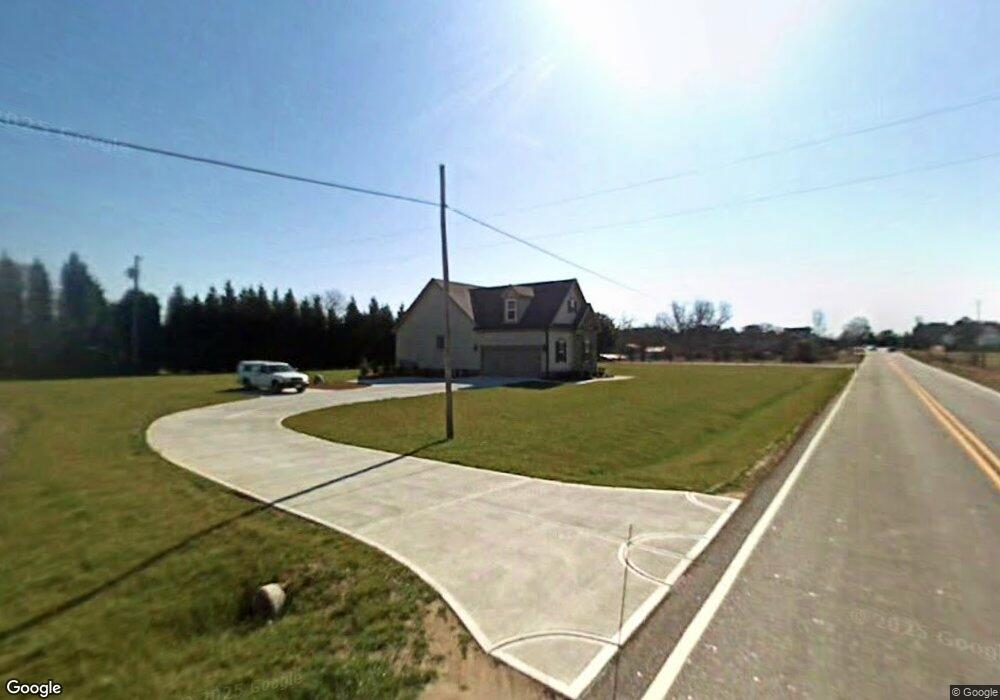
1737 Piney Grove Wilbon Rd Holly Springs, NC 27540
Estimated Value: $522,000 - $580,000
3
Beds
2
Baths
2,345
Sq Ft
$234/Sq Ft
Est. Value
About This Home
This home is located at 1737 Piney Grove Wilbon Rd, Holly Springs, NC 27540 and is currently estimated at $549,656, approximately $234 per square foot. 1737 Piney Grove Wilbon Rd is a home located in Wake County with nearby schools including Buckhorn Creek Elementary, Fuquay-Varina High, and Southern Wake Academy.
Ownership History
Date
Name
Owned For
Owner Type
Purchase Details
Closed on
Oct 31, 2018
Sold by
Evans Janet Gailya
Bought by
Robinson Kurt and Robinson Katherine
Current Estimated Value
Home Financials for this Owner
Home Financials are based on the most recent Mortgage that was taken out on this home.
Original Mortgage
$260,000
Outstanding Balance
$161,020
Interest Rate
4.1%
Mortgage Type
New Conventional
Estimated Equity
$388,636
Purchase Details
Closed on
Jan 9, 2007
Sold by
Wood Lonnie E and Wood Hazel
Bought by
Evans Vernon Wade and Evans Janet Gailya
Purchase Details
Closed on
Jul 2, 2003
Sold by
Beasley Susie W and Wilson John
Bought by
Wood Lonnie E and Wood Hazel
Home Financials for this Owner
Home Financials are based on the most recent Mortgage that was taken out on this home.
Original Mortgage
$175,000
Interest Rate
5.3%
Mortgage Type
Seller Take Back
Create a Home Valuation Report for This Property
The Home Valuation Report is an in-depth analysis detailing your home's value as well as a comparison with similar homes in the area
Home Values in the Area
Average Home Value in this Area
Purchase History
| Date | Buyer | Sale Price | Title Company |
|---|---|---|---|
| Robinson Kurt | $325,000 | None Available | |
| Evans Vernon Wade | $40,000 | None Available | |
| Wood Lonnie E | $200,000 | -- |
Source: Public Records
Mortgage History
| Date | Status | Borrower | Loan Amount |
|---|---|---|---|
| Open | Robinson Kurt | $260,000 | |
| Previous Owner | Wood Lonnie E | $175,000 |
Source: Public Records
Tax History Compared to Growth
Tax History
| Year | Tax Paid | Tax Assessment Tax Assessment Total Assessment is a certain percentage of the fair market value that is determined by local assessors to be the total taxable value of land and additions on the property. | Land | Improvement |
|---|---|---|---|---|
| 2025 | $3,367 | $523,282 | $110,000 | $413,282 |
| 2024 | $3,270 | $523,282 | $110,000 | $413,282 |
| 2023 | $2,629 | $334,673 | $50,400 | $284,273 |
| 2022 | $2,437 | $334,673 | $50,400 | $284,273 |
| 2021 | $2,372 | $334,673 | $50,400 | $284,273 |
| 2020 | $2,333 | $334,673 | $50,400 | $284,273 |
| 2019 | $2,390 | $290,225 | $40,000 | $250,225 |
| 2018 | $2,198 | $290,225 | $40,000 | $250,225 |
| 2017 | $2,084 | $290,225 | $40,000 | $250,225 |
| 2016 | $2,041 | $290,225 | $40,000 | $250,225 |
| 2015 | -- | $327,666 | $40,000 | $287,666 |
| 2014 | -- | $327,666 | $40,000 | $287,666 |
Source: Public Records
Map
Nearby Homes
- 1421 Hopson Downs Ct
- 7309 Rouse Rd
- 6625 Maggiewood Ln
- 1313&1317 Wilbon Rd
- 7124 Asheway Dr
- 0 Piney Grove Wilbon Rd Unit 10115196
- 608 Ressler St
- 0 Commission Dr
- 5824 Adcock Rd
- 7212 Waltridge Place
- 909 Wilbon Rd
- 605 Hampton Crest Ct
- 975 Wilbon
- 1528 Maelyn Way
- 947 Briar Gate Dr
- 916 Briar Gate Dr
- 1210 Briar Gate Dr
- 209 Kephart Way
- 809 Briar Gate Dr
- 4601 Basilica Dr
- 5709 Canadian Mist Ln
- 5732 Canadian Mist Ln
- 5732 Canadian Mist Ln
- 5728 Canadian Mist Ln
- 1813 Piney Grove Wilbon Rd
- 1813 Piney Grove-Wilbon Rd
- 1725 Piney Grove Wilbon Rd
- 7429 Rouse Rd
- 6400 Sarrucca Ct
- 6404 Sarrucca Ct
- 5737 Spence Farm Rd
- 5741 Spence Farm Rd
- 3132 Wilbon Ridge Dr
- 3136 Wilbon Ridge Dr
- 6280 Brackney Trail
- 6408 Sarrucca Ct
- 6281 Brackney Trail
- 6401 Sarrucca Ct
- 6500 Owego Ct
- 6284 Brackney Tr