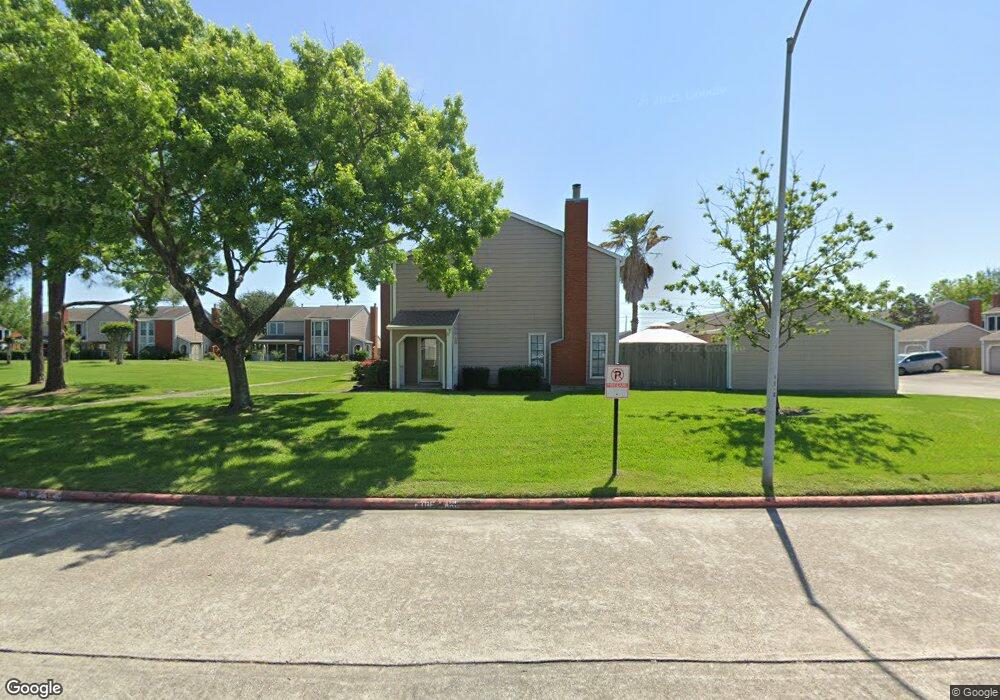
17371 Saturn Ln Unit 7 Houston, TX 77058
Clear Lake NeighborhoodEstimated Value: $190,000 - $219,000
3
Beds
3
Baths
1,320
Sq Ft
$158/Sq Ft
Est. Value
About This Home
This home is located at 17371 Saturn Ln Unit 7, Houston, TX 77058 and is currently estimated at $208,493, approximately $157 per square foot. 17371 Saturn Ln Unit 7 is a home located in Harris County with nearby schools including Falcon Pass Elementary School, Space Center Intermediate, and Clear Lake High School.
Ownership History
Date
Name
Owned For
Owner Type
Purchase Details
Closed on
Feb 15, 2022
Sold by
Michael Day Kristopher
Bought by
Morgan Norah
Current Estimated Value
Home Financials for this Owner
Home Financials are based on the most recent Mortgage that was taken out on this home.
Original Mortgage
$149,600
Outstanding Balance
$139,148
Interest Rate
3.69%
Mortgage Type
New Conventional
Estimated Equity
$69,345
Purchase Details
Closed on
Aug 23, 2013
Sold by
Gutierrez Linda and Hernandez Arnold Rey
Bought by
Day Kristopher Michael and Day Afang
Purchase Details
Closed on
Sep 8, 2008
Sold by
Nosrat Shirin R
Bought by
Gutierrez Linda
Purchase Details
Closed on
Jun 28, 1996
Sold by
Wood Louise S
Bought by
Nosrat Shirin R
Home Financials for this Owner
Home Financials are based on the most recent Mortgage that was taken out on this home.
Original Mortgage
$60,800
Interest Rate
8.1%
Create a Home Valuation Report for This Property
The Home Valuation Report is an in-depth analysis detailing your home's value as well as a comparison with similar homes in the area
Home Values in the Area
Average Home Value in this Area
Purchase History
| Date | Buyer | Sale Price | Title Company |
|---|---|---|---|
| Morgan Norah | -- | First American Title | |
| Day Kristopher Michael | -- | Chicago Title | |
| Gutierrez Linda | -- | Texas American Title Company | |
| Nosrat Shirin R | -- | Citizens Title Company |
Source: Public Records
Mortgage History
| Date | Status | Borrower | Loan Amount |
|---|---|---|---|
| Open | Morgan Norah | $149,600 | |
| Previous Owner | Nosrat Shirin R | $60,800 |
Source: Public Records
Tax History Compared to Growth
Tax History
| Year | Tax Paid | Tax Assessment Tax Assessment Total Assessment is a certain percentage of the fair market value that is determined by local assessors to be the total taxable value of land and additions on the property. | Land | Improvement |
|---|---|---|---|---|
| 2025 | $4,671 | $207,158 | $43,850 | $163,308 |
| 2024 | $4,671 | $199,024 | $43,850 | $155,174 |
| 2023 | $4,671 | $208,424 | $43,850 | $164,574 |
| 2022 | $4,442 | $181,783 | $43,850 | $137,933 |
| 2021 | $4,684 | $181,783 | $36,540 | $145,243 |
| 2020 | $4,666 | $168,759 | $30,450 | $138,309 |
| 2019 | $4,883 | $168,759 | $30,450 | $138,309 |
| 2018 | $1,722 | $140,715 | $21,750 | $118,965 |
| 2017 | $3,808 | $131,704 | $21,750 | $109,954 |
| 2016 | $3,661 | $126,612 | $14,500 | $112,112 |
| 2015 | $2,561 | $116,696 | $14,500 | $102,196 |
| 2014 | $2,561 | $107,900 | $14,500 | $93,400 |
Source: Public Records
Map
Nearby Homes
- 17203 Saturn Ln
- 1414 Gemini St Unit 1I
- 16502 Holly Trail Dr
- 1702 Plumbwood Way
- 1603 Mary Mount Way
- 1500 Bay Area Blvd Unit P286
- 1500 Bay Area Blvd Unit B105
- 1500 Bay Area Blvd Unit 294
- 1500 Bay Area Blvd Unit 424
- 1500 Bay Area Blvd Unit 440
- 1500 Bay Area Blvd Unit 155
- 1500 Bay Area Blvd Unit 422
- 1500 Bay Area Blvd Unit 126
- 1723 Plumbwood Way
- 1719 Sullins Way
- 1810 Barleton Way
- 1516 Bay Area Blvd Unit 8
- 1516 Bay Area Blvd Unit L6
- 1516 Bay Area Blvd Unit P23
- 1516 Bay Area Blvd Unit 1
- 17371 Saturn Ln
- 17369 Saturn Ln
- 17373 Saturn Ln
- 17375 Saturn Ln
- 17367 Saturn Ln
- 17365 Saturn Ln
- 17365 Saturn Ln
- 17363 Saturn Ln
- 17361 Saturn Ln
- 17361 Saturn Ln Unit 2
- 17343 Saturn Ln
- 17345 Saturn Ln
- 17341 Saturn Ln
- 17347 Saturn Ln
- 17359 Saturn Ln
- 16833 Holly Trail Dr
- 17349 Saturn Ln
- 17245 Saturn Ln
- 16831 Holly Trail Dr
- 17351 Saturn Ln