Estimated Value: $243,000 - $297,000
3
Beds
1
Bath
960
Sq Ft
$283/Sq Ft
Est. Value
About This Home
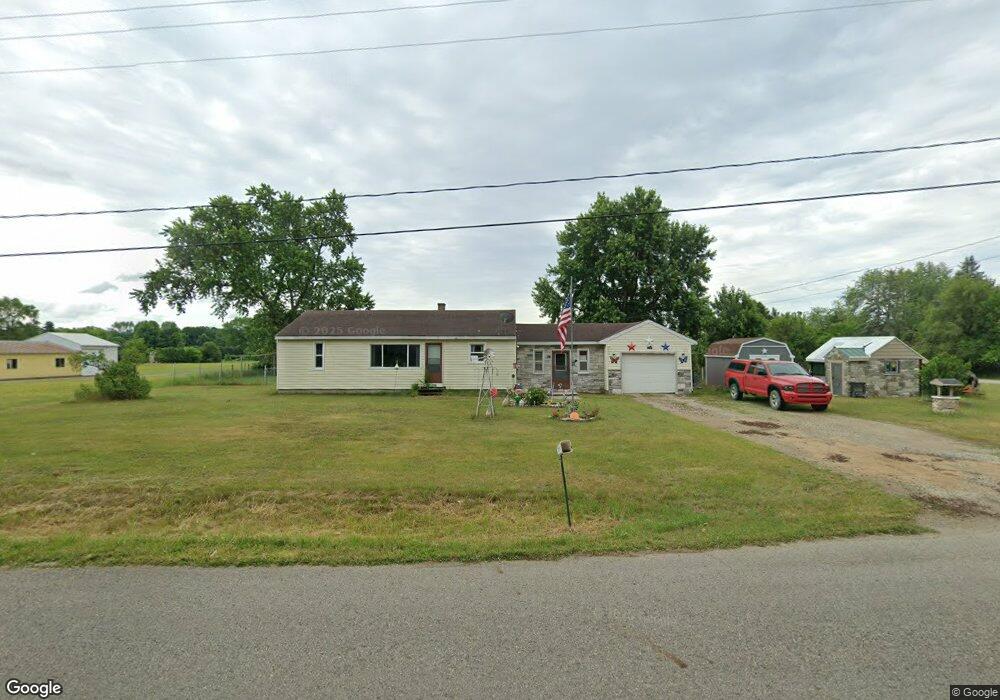
This home is located at 1738 143rd Ave, Dorr, MI 49323 and is currently estimated at $271,317, approximately $282 per square foot. 1738 143rd Ave is a home located in Allegan County with nearby schools including Wayland High School, Byron Center Charter School, and St. Stanislaus School.
Ownership History
Date
Name
Owned For
Owner Type
Purchase Details
Closed on
Feb 15, 2018
Sold by
Wiama Bonny and Walma Bonny
Bought by
Walma Bonny
Current Estimated Value
Home Financials for this Owner
Home Financials are based on the most recent Mortgage that was taken out on this home.
Original Mortgage
$64,500
Outstanding Balance
$54,626
Interest Rate
3.99%
Mortgage Type
New Conventional
Estimated Equity
$216,691
Purchase Details
Closed on
Feb 5, 2009
Sold by
Godley Investments Llc and Godley Gary
Bought by
United Bank Mortgage Corporation
Purchase Details
Closed on
Apr 24, 2008
Sold by
Godley Investments Llc
Bought by
Godley Judy K
Purchase Details
Closed on
Feb 20, 2007
Sold by
Bartz Joann and Myers Patricia
Bought by
Godley Investments Llc
Home Financials for this Owner
Home Financials are based on the most recent Mortgage that was taken out on this home.
Original Mortgage
$124,000
Interest Rate
6.28%
Mortgage Type
Commercial
Create a Home Valuation Report for This Property
The Home Valuation Report is an in-depth analysis detailing your home's value as well as a comparison with similar homes in the area
Home Values in the Area
Average Home Value in this Area
Purchase History
| Date | Buyer | Sale Price | Title Company |
|---|---|---|---|
| Walma Bonny | -- | First American Title Ins Co | |
| United Bank Mortgage Corporation | $90,000 | None Available | |
| Godley Judy K | -- | Chicago Title | |
| Godley Investments Llc | $155,000 | Metropolitan Title Company |
Source: Public Records
Mortgage History
| Date | Status | Borrower | Loan Amount |
|---|---|---|---|
| Open | Walma Bonny | $64,500 | |
| Previous Owner | Godley Investments Llc | $124,000 |
Source: Public Records
Tax History
| Year | Tax Paid | Tax Assessment Tax Assessment Total Assessment is a certain percentage of the fair market value that is determined by local assessors to be the total taxable value of land and additions on the property. | Land | Improvement |
|---|---|---|---|---|
| 2025 | $1,648 | $103,100 | $23,000 | $80,100 |
| 2024 | $1,525 | $96,200 | $19,400 | $76,800 |
| 2023 | $1,560 | $86,200 | $18,500 | $67,700 |
| 2022 | $1,525 | $74,700 | $16,600 | $58,100 |
| 2021 | $1,402 | $71,900 | $16,100 | $55,800 |
| 2020 | $1,344 | $71,100 | $16,600 | $54,500 |
| 2019 | $1,344 | $70,300 | $16,600 | $53,700 |
| 2018 | $1,316 | $61,900 | $16,600 | $45,300 |
| 2017 | $0 | $55,800 | $8,200 | $47,600 |
| 2016 | $0 | $45,900 | $13,400 | $32,500 |
| 2015 | -- | $45,900 | $13,400 | $32,500 |
| 2014 | -- | $41,900 | $13,400 | $28,500 |
| 2013 | -- | $38,300 | $11,600 | $26,700 |
Source: Public Records
Map
Nearby Homes
- 1341 142nd Ave
- Lots A&B 142nd Ave
- 4087 Gene Ct
- 4035 Patti Rd
- 4069 21st St
- 4335 Tavistock Dr
- 4316 Sussex Place
- 1125 Russell St
- 4273 Highpoint Dr Unit 112
- 4269 Highpoint Dr Unit 114
- 4271 Highpoint Dr Unit 113
- 4294 Highpoint Dr Unit 103
- 1069 Sunnyside Dr
- 4279 Highpoint Dr
- 10780 Windward Ave SW
- 4185 24th St
- 10785 Windward Ave SW
- 4249 Butternut Dr
- 4245 Butternut Dr
- 4243 Butternut Dr
- 4293 Cheetah Run Dr Unit 1
- 4305 Alpine St
- 4289 Cheetah Run Dr Unit 2
- 0 Cheetah Run Dr
- 5 Cheetah Run Dr
- 11 Cheetah Run Dr
- 4 Cheetah Run Dr
- 6 Cheetah Run Dr
- 1742 143rd Ave
- 1743 143rd Ave
- 1735 143rd Ave
- 1726 143rd Ave
- 4311 Alpine St
- 4285 Cheetah Run Dr Unit 3
- 1745 143rd Ave
- 4312 Alpine St
- 1725 143rd Ave
- 4315 Alpine St
- 4281 Cheetah Run Dr
- 1720 143rd Ave
Your Personal Tour Guide
Ask me questions while you tour the home.