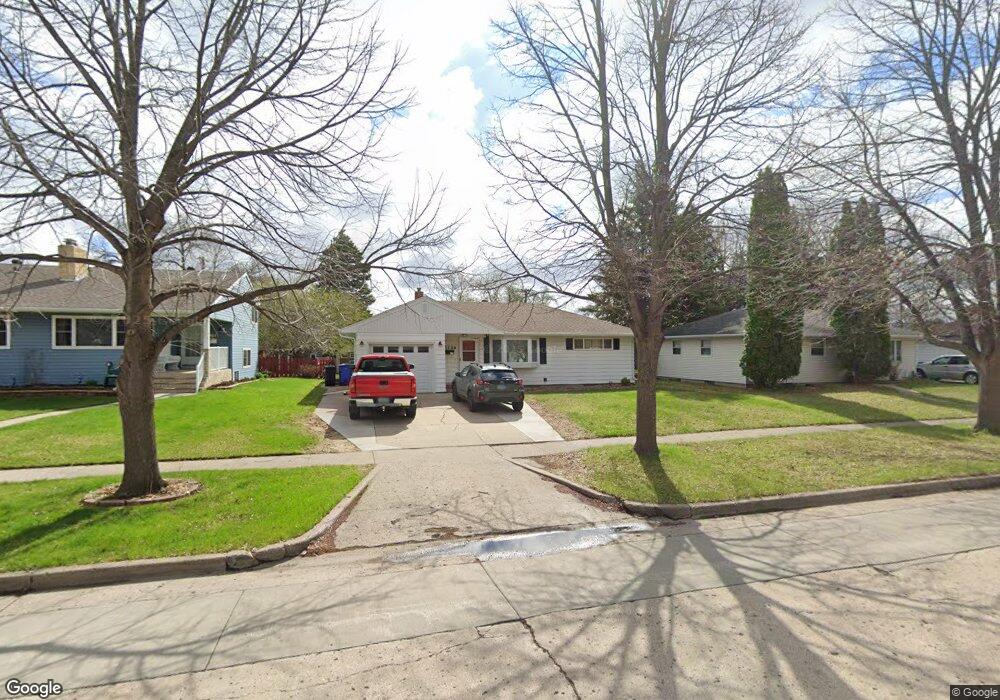
1738 6th St S Fargo, ND 58103
Clara Barton NeighborhoodEstimated Value: $250,000 - $276,000
--
Bed
--
Bath
1,113
Sq Ft
$241/Sq Ft
Est. Value
About This Home
This home is located at 1738 6th St S, Fargo, ND 58103 and is currently estimated at $267,997, approximately $240 per square foot. 1738 6th St S is a home located in Cass County with nearby schools including Clara Barton Elementary School, Carl Ben Eielson Middle School, and South High School.
Ownership History
Date
Name
Owned For
Owner Type
Purchase Details
Closed on
Jan 30, 2019
Sold by
Carlson Robert D and Carlson Natalie J
Bought by
Carlson Nicholas
Current Estimated Value
Home Financials for this Owner
Home Financials are based on the most recent Mortgage that was taken out on this home.
Original Mortgage
$14,400,000
Outstanding Balance
$12,685,728
Interest Rate
4.6%
Mortgage Type
Construction
Estimated Equity
-$12,417,731
Purchase Details
Closed on
Jan 2, 2016
Sold by
Ellis Douglas William
Bought by
Carlson Robert D and Carlson Natalie J
Purchase Details
Closed on
Dec 9, 2015
Sold by
Dunn Karen Ellis and Dunn Larry Woodrow
Bought by
Carlson Robert D and Carlson Natalie J
Purchase Details
Closed on
Dec 7, 2015
Sold by
Ellis Frederick
Bought by
Carlson Robert D and Carlson Natalie J
Purchase Details
Closed on
Nov 10, 2015
Sold by
Dunn Karen Ellis and Estate Of Howard Ellis
Bought by
Dunn Karen Ellis and Ellis Douglas
Create a Home Valuation Report for This Property
The Home Valuation Report is an in-depth analysis detailing your home's value as well as a comparison with similar homes in the area
Home Values in the Area
Average Home Value in this Area
Purchase History
| Date | Buyer | Sale Price | Title Company |
|---|---|---|---|
| Carlson Nicholas | $180,000 | Plains Title Llc | |
| Carlson Robert D | -- | None Available | |
| Carlson Robert D | -- | None Available | |
| Carlson Robert D | -- | None Available | |
| Dunn Karen Ellis | -- | None Available |
Source: Public Records
Mortgage History
| Date | Status | Borrower | Loan Amount |
|---|---|---|---|
| Open | Carlson Nicholas | $14,400,000 |
Source: Public Records
Tax History Compared to Growth
Tax History
| Year | Tax Paid | Tax Assessment Tax Assessment Total Assessment is a certain percentage of the fair market value that is determined by local assessors to be the total taxable value of land and additions on the property. | Land | Improvement |
|---|---|---|---|---|
| 2024 | $3,638 | $143,700 | $29,050 | $114,650 |
| 2023 | $3,866 | $134,300 | $29,050 | $105,250 |
| 2022 | $3,128 | $104,900 | $29,050 | $75,850 |
| 2021 | $2,936 | $99,650 | $30,100 | $69,550 |
| 2020 | $2,921 | $99,650 | $30,100 | $69,550 |
| 2019 | $2,733 | $93,150 | $18,800 | $74,350 |
| 2018 | $2,701 | $93,150 | $18,800 | $74,350 |
| 2017 | $2,605 | $90,450 | $18,800 | $71,650 |
| 2016 | $2,350 | $87,800 | $18,800 | $69,000 |
| 2015 | $2,144 | $74,100 | $12,800 | $61,300 |
| 2014 | $2,049 | $68,600 | $12,800 | $55,800 |
| 2013 | $2,051 | $68,600 | $12,800 | $55,800 |
Source: Public Records
Map
Nearby Homes