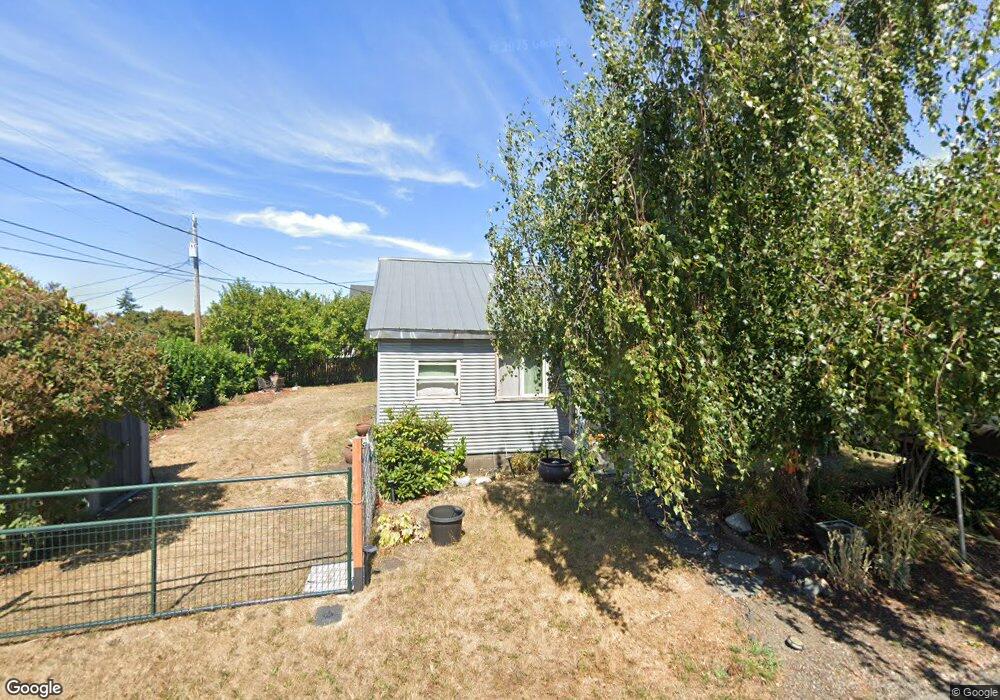
1738 Garfield St Port Townsend, WA 98368
Estimated Value: $520,000 - $544,412
1
Bed
1
Bath
1,045
Sq Ft
$514/Sq Ft
Est. Value
About This Home
This home is located at 1738 Garfield St, Port Townsend, WA 98368 and is currently estimated at $537,103, approximately $513 per square foot. 1738 Garfield St is a home located in Jefferson County with nearby schools including Salish Coast Elementary School, Blue Heron Middle School, and Port Townsend High School.
Ownership History
Date
Name
Owned For
Owner Type
Purchase Details
Closed on
Apr 4, 2017
Sold by
Johnston Andrew and Johnston Gina
Bought by
Johnston Gina
Current Estimated Value
Purchase Details
Closed on
Jan 3, 2007
Sold by
Johnston Gina
Bought by
Johnston Gina and Johnston Andrew
Purchase Details
Closed on
Jun 6, 2006
Sold by
Johnston Andrew
Bought by
Johnsont Gina M
Home Financials for this Owner
Home Financials are based on the most recent Mortgage that was taken out on this home.
Original Mortgage
$197,000
Interest Rate
6.56%
Mortgage Type
Purchase Money Mortgage
Purchase Details
Closed on
Jun 5, 2006
Sold by
Christiansen Daniel
Bought by
Johnston Gina M
Home Financials for this Owner
Home Financials are based on the most recent Mortgage that was taken out on this home.
Original Mortgage
$197,000
Interest Rate
6.56%
Mortgage Type
Purchase Money Mortgage
Create a Home Valuation Report for This Property
The Home Valuation Report is an in-depth analysis detailing your home's value as well as a comparison with similar homes in the area
Home Values in the Area
Average Home Value in this Area
Purchase History
| Date | Buyer | Sale Price | Title Company |
|---|---|---|---|
| Johnston Gina | -- | Jefferson Title Co Inc | |
| Johnston Gina | -- | Jefferson Title Co | |
| Johnsont Gina M | -- | None Available | |
| Johnston Gina M | $120,000 | None Available |
Source: Public Records
Mortgage History
| Date | Status | Borrower | Loan Amount |
|---|---|---|---|
| Previous Owner | Johnston Gina M | $197,000 |
Source: Public Records
Tax History Compared to Growth
Tax History
| Year | Tax Paid | Tax Assessment Tax Assessment Total Assessment is a certain percentage of the fair market value that is determined by local assessors to be the total taxable value of land and additions on the property. | Land | Improvement |
|---|---|---|---|---|
| 2024 | $2,849 | $336,983 | $253,000 | $83,983 |
| 2023 | $2,849 | $316,873 | $236,250 | $80,623 |
| 2022 | $2,467 | $293,905 | $220,000 | $73,905 |
| 2021 | $2,352 | $253,793 | $192,000 | $61,793 |
| 2020 | $2,202 | $233,379 | $176,000 | $57,379 |
| 2019 | $1,808 | $212,966 | $160,000 | $52,966 |
| 2018 | $1,997 | $190,027 | $145,000 | $45,027 |
| 2017 | $1,854 | $183,524 | $143,000 | $40,524 |
| 2016 | $1,739 | $182,023 | $143,000 | $39,023 |
| 2015 | $1,735 | $177,521 | $143,000 | $34,521 |
| 2014 | -- | $176,020 | $143,000 | $33,020 |
| 2013 | -- | $160,020 | $130,000 | $30,020 |
Source: Public Records
Map
Nearby Homes
- 1602 Lincoln St
- 1930 Lawrence St Unit A31
- 0 St Unit Port Hadlock WA 9836
- 2021 Clay St
- 543 Van Buren St
- 1738 Washington St
- 301 E St
- 308 E St
- 800 Polk St Unit 204C
- 7 XXX Water St
- 538 Adams St
- 842 Washington St Unit 204
- 717 Franklin St
- 9999 Maple Parcel A & B St
- 9999 Maple Parcel A St
- 509 Garfield St
- 1055 Monroe St
- 1431 Beech St
- 537 Jackson St
- 999 Reed St