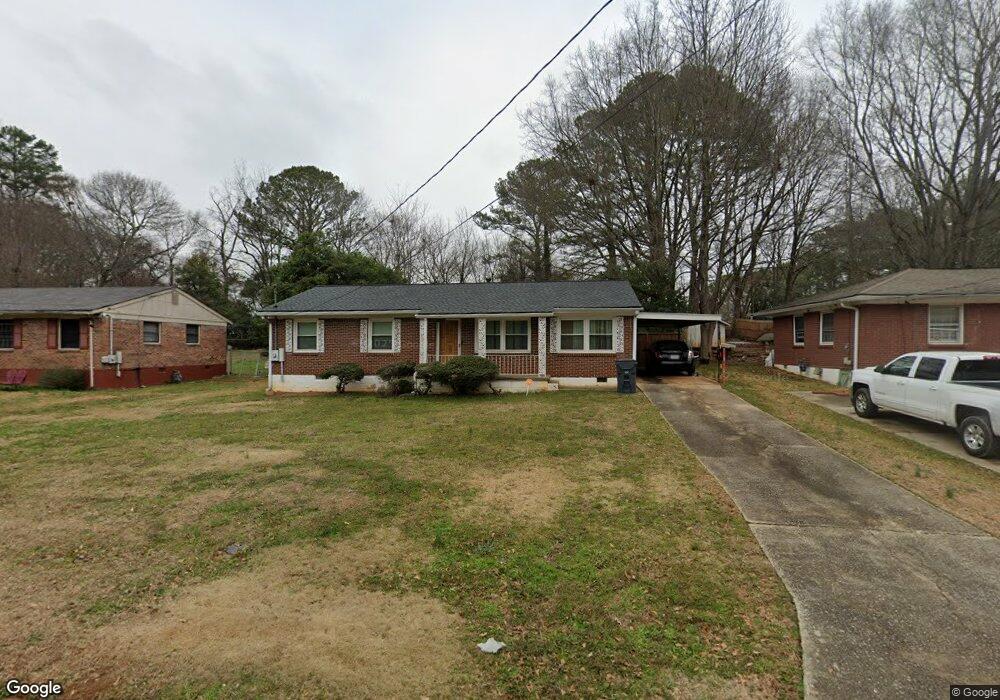
1738 Glenn Place Unit 3 Conley, GA 30288
Estimated Value: $166,254 - $196,000
3
Beds
1
Bath
1,296
Sq Ft
$141/Sq Ft
Est. Value
About This Home
This home is located at 1738 Glenn Place Unit 3, Conley, GA 30288 and is currently estimated at $182,314, approximately $140 per square foot. 1738 Glenn Place Unit 3 is a home located in Clayton County with nearby schools including Anderson Elementary School, Forest Park Middle School, and Forest Park High School.
Ownership History
Date
Name
Owned For
Owner Type
Purchase Details
Closed on
Oct 21, 2020
Sold by
Capital For Deals Llc
Bought by
Skaria Giji
Current Estimated Value
Home Financials for this Owner
Home Financials are based on the most recent Mortgage that was taken out on this home.
Original Mortgage
$81,735
Outstanding Balance
$72,699
Interest Rate
2.9%
Mortgage Type
Commercial
Estimated Equity
$109,615
Purchase Details
Closed on
Dec 3, 2010
Sold by
Wells Fargo Bk Na
Bought by
Williams Frances
Purchase Details
Closed on
Sep 7, 2010
Sold by
Coffield James R
Bought by
Wells Fargo Bk Na
Purchase Details
Closed on
Nov 2, 2004
Sold by
Abn Amro Mtg Gp Inc
Bought by
Hud
Purchase Details
Closed on
Aug 29, 2002
Sold by
Simmons Helen G
Bought by
Miller Myletha
Home Financials for this Owner
Home Financials are based on the most recent Mortgage that was taken out on this home.
Original Mortgage
$96,485
Interest Rate
6.4%
Mortgage Type
FHA
Create a Home Valuation Report for This Property
The Home Valuation Report is an in-depth analysis detailing your home's value as well as a comparison with similar homes in the area
Home Values in the Area
Average Home Value in this Area
Purchase History
| Date | Buyer | Sale Price | Title Company |
|---|---|---|---|
| Skaria Giji | $89,000 | -- | |
| Capital For Deals Llc | $80,000 | -- | |
| Williams Frances | $14,900 | -- | |
| Wells Fargo Bk Na | $24,347 | -- | |
| Hud | -- | -- | |
| Abn Amro Mtg Gp Inc | $106,403 | -- | |
| Miller Myletha | $98,000 | -- |
Source: Public Records
Mortgage History
| Date | Status | Borrower | Loan Amount |
|---|---|---|---|
| Open | Capital For Deals Llc | $81,735 | |
| Closed | Skaria Giji | $81,735 | |
| Previous Owner | Miller Myletha | $96,485 |
Source: Public Records
Tax History Compared to Growth
Tax History
| Year | Tax Paid | Tax Assessment Tax Assessment Total Assessment is a certain percentage of the fair market value that is determined by local assessors to be the total taxable value of land and additions on the property. | Land | Improvement |
|---|---|---|---|---|
| 2024 | $2,800 | $71,760 | $6,400 | $65,360 |
| 2023 | $2,211 | $61,240 | $6,400 | $54,840 |
| 2022 | $1,865 | $47,520 | $6,400 | $41,120 |
| 2021 | $1,264 | $32,000 | $5,680 | $26,320 |
| 2020 | $1,122 | $28,060 | $6,400 | $21,660 |
| 2019 | $1,025 | $25,257 | $4,800 | $20,457 |
| 2018 | $843 | $20,760 | $4,800 | $15,960 |
| 2017 | $730 | $17,932 | $4,800 | $13,132 |
| 2016 | $712 | $17,491 | $4,800 | $12,691 |
| 2015 | $589 | $0 | $0 | $0 |
| 2014 | $754 | $18,948 | $6,400 | $12,548 |
Source: Public Records
Map
Nearby Homes
- 1711 Rock Cut Rd
- 4308 Sheppard Dr Unit 3
- 4346 Edinburgh Way Unit 1
- 1660 Mallard Cir
- 1822 Slate Rd
- 1556 Rock Cut Rd
- 1521 Valley Green Ct
- 4170 Jewell Terrace
- 1506 Ravenel Rd Unit 3
- 4175 Cottage Ln
- 1591 Marceau Dr
- 4302 Rocklane Dr
- 1496 Greenwillow Dr
- 1461 Enchanted Forest Dr
- 4479 Richard Rd
- 4061 Jewell Terrace
- 1625 Conley Rd Unit 235
- 1625 Conley Rd Unit 171
- 1625 Conley Rd Unit 43
- 1625 Conley Rd Unit 181
- 1732 Glenn Place Unit 3
- 1746 Glenn Place
- 1722 Glenn Place
- 4317 Sheppard Dr
- 4307 Sheppard Dr Unit 3
- 4321 Sheppard Dr
- 4301 Sheppard Dr
- 1719 Rock Cut Rd Unit 1
- 1715 Rock Cut Rd
- 1739 Glenn Place
- 1733 Glenn Place
- 1747 Glenn Place
- 0 Glenn Place Unit 7319538
- 1723 Glenn Place
- 4291 Sheppard Dr Unit 3
- 1707 Rock Cut Rd
- 1753 Glenn Place Unit 3
- 0 Sheppard Dr Unit 7234803
- 0 Sheppard Dr Unit 8877440
- 0 Sheppard Dr Unit 8301014